Back in January I started to compare the new standard 30-year climate normal period, 1991-2020, to the previous 1981-2010 benchmark. This week NOAA released the complete new climate normals, so it's worth returning to the topic, with a focus this time on precipitation.
Most parts of the state saw an increase in annual average precipitation, which is broadly to be expected at high latitudes during a warming trend. According to NOAA's climate division data, the largest increases were found in the north and west, while the northeastern Gulf coast and south-central Alaska were the only regions with a slight drying trend.
Interestingly, Fairbanks saw a greater increase in precipitation than the regional climate division data would suggest, with a +7.4% annual change that was quite well distributed throughout the year - although August and September stand out as having the largest changes in absolute terms. July remains the wettest month of the year in Fairbanks; this was true for the first time in the 1981-2010 normals, and prior to that August held the top spot.
Precipitation is quite uncertain in much of Alaska because of the lack of good long-term observing sites across the vast area, so model-derived data can be a helpful complement. Surprisingly, the ERA5 reanalysis actually suggests that precipitation has decreased slightly in parts of Alaska's interior - see below. Obviously a more detailed comparison with (the limited) ground-truth data would be worthwhile to see whether Fairbanks is indeed an outlier with its more notable moistening trend.
If we look at seasonal changes around the state, summer and autumn account for most of the change in the west and north, and of course this is the wetter half of the year. See below for graphics comparing the NCEI and ERA5 data for each of the four standard seasons. (I attempted to set these up in a side-by-side table for easy viewing, but the blog editor didn't like that plan.)
ERA5 suggests that Arctic Alaska has become wetter throughout the year,
but NCEI emphasizes the autumn increase, which is clearly related to
reduced sea ice, more open water, and much warmer and moister air. Climate data from Utqiaġvik does support a more uniform increase in precipitation throughout the year:
The
rather notable drying trend in winter across the west-central interior and south-central Alaska is related to the persistent ridge of
high pressure that has often dominated the regional circulation over the
northeastern Pacific since 2013. Observations from McGrath do reflect a modest decrease in winter precipitation, although I'm far from confident about the state of winter precipitation measurements at that location. However, Anchorage shows no sign of drying out in winter.
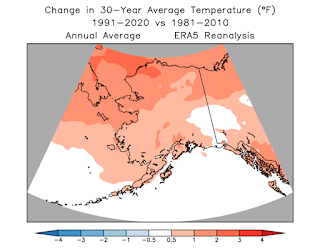
Since I have the maps handy, here's a similar comparison of NCEI and ERA5 temperature changes, for the annual average and the four seasons. There's a major discrepancy in Southeast Alaska, where ERA5 shows far too much warming, presumably because of the model's inability to represent the complex terrain, but elsewhere the comparison is fairly good.


