Once every 10 years, the world of climate science transitions to a new 30-year normal period for the purpose of climate monitoring, and 2020 marked the end of the most recent normal period. The choice of a 30-year window is nothing more than conventional practice; here's a bit of background from the WMO (click to enlarge).
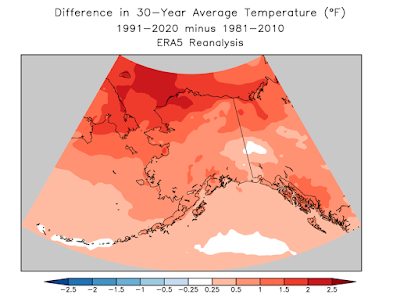
Based on ERA5 gridded data, here's a look at how Alaska's annual average temperature changed between 1981-2010 and 1991-2020:
Most of Alaska to the north of about 65°N warmed by more than 1°F, and of course the greatest change was seen on the North Slope - and especially in Alaska's northwestern Arctic territory. Substantial warming of more than 1°F also occurred in the southern half of the Alaska Panhandle, according to this data.
Here's how the changes look in the wider hemispheric context north of 45°N. Alaska's Arctic warming was only a small portion of a wide swath of 1.5-2°F warming that stretched across the Russian side of the Arctic to the Barents Sea.
The ERA5 temperature changes are broadly consistent with data from surface observing sites across Alaska. According to NOAA/NCEI data, the state warmed 0.8°F as a whole, and climate observations include changes of +2.0°F at Utqiaġvik, +0.3°F at Fairbanks, and +0.7°F at Anchorage. Interestingly, however, Juneau warmed only 0.2°F, considerably less than ERA5 suggests. It would be worth looking at other sites in the southeast, but it's likely that ERA5 has difficulty representing valley-level temperatures in the complex topography of Alaska's southern coast.
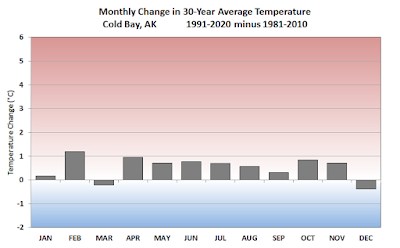
Here's a series of charts to illustrate the month-by-month changes in the temperature normals at a variety of sites. All have the same vertical scale, and the series goes roughly from north to south. Click to enlarge.
In addition to the well-known autumn warming that is most dramatic in the Arctic (where it is linked to ice loss), it's interesting to see a large temperature increase at Alaska's western sites in February and April - although not in March. Presumably year-to-year variability is to blame for the March outlier, because after all we're really just taking the difference between two decades: the 1980s and the 2010s. Taking the late winter period as a whole (February-April), I'd wager that the notable warming is closely linked to loss of Bering Sea ice in just the last few years; 2018 and 2019 in particular had extremely low ice extent, and temperatures were far above normal at the end of winter.
Finally, here's the month-to-month chart for Alaska as a whole.


I must say I find the new normal temperatures much more exciting than the old normal....which...lets face it...had grown to be quite boring.
ReplyDeleteI'd like to find out more about why March is marching to a different drummer.
ReplyDeleteMe too! I'll dig into it.
Delete