Monday, September 28, 2020

Brooks Range Chinook

Yesterday afternoon the temperature reports across northern Alaska caught my eye, with a striking temperature contrast across the Brooks Range.  Mid-elevation stations on the north side of the divide, such as Anaktuvuk Pass and Howard Pass, saw temperatures around 20°F - nothing unusual for the time of year - but downsloping produced dramatic warming on the south side of the mountains.  Bettles reached 54°F, and the Norutak Lake RAWS hit 56°F, which is very warm for so late in September.

Here's a map of temperature reports at 5pm AKDT - click to enlarge.

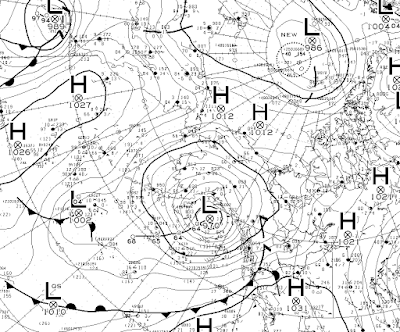
A very strong Gulf of Alaska storm explains this situation, as there was a pronounced north-south pressure gradient across the state at 4pm yesterday - see below.  As a result, strong cross-barrier flow occurred over the Brooks Range, and impressive chinook warming was able to develop even though the elevation changes are more subtle than in southern Alaska (Anaktuvuk Pass and Norutak Lake differ by only 1300').  Such is the power of elevation for modifying weather and climate.


Sunday, September 27, 2020

La Niña Winter On Tap

Even casual observers of weather and climate are probably aware that a La Niña episode is currently under way in the tropical Pacific Ocean, and this will affect the weather patterns that unfold in the higher latitudes as we go into Northern Hemisphere winter.  In particular, Alaska tends to see quite reliable winter impacts from La Niña: namely, colder than normal, particularly in the south, and often drier than normal in the south and southeast.

Here are a couple of overview maps based on strong La Niña conditions since 1950, showing the percent of winters with above-normal temperature and precipitation respectively.  The temperature data is obtained from the NCEP/NCAR global reanalysis, and we're not taking into account long-term trends: the "normal" baseline here is 1951-2010.


The cold in southern Alaska is very clearly connected to cold across the northeastern Pacific, which reflects a negative phase of the PDO (Pacific Decadal Oscillation); all of the top La Niña winters also have a negative PDO.  Currently the PDO is negative, but that's not because the northeastern Pacific is cool; it's just less extremely warm than the waters to the north of Hawaii, and that makes for a negative PDO index.  So given that current SSTs are well above normal, not below normal, in the Gulf of Alaska, we would expect this to take the edge off the La Niña cold in southern Alaska - at least until the SST pattern shifts towards a more canonical negative PDO state.


A more focused view of what we might expect this winter is shown in the figures below.  Here I've selected past years with La Niña conditions in autumn and then looked ahead to winter; this avoids making the assumption that La Niña will be strong throughout winter.  I've also restricted myself to La Niña years since 1979, I'm using the ERA5 reanalysis, and I'm showing the average departure from normal rather than the percent of years above normal.

The temperature signal is quite substantial in this average of 8 similar years, with a negative departure from normal of 1.5-2°C from the western interior to the northern Alaska Peninsula.  Compare this to the climatological (interannual) standard deviation of a little over 2°C for the 5-month period of November through March.  The average precipitation anomalies are relatively less dramatic, with south-central Alaska seeing a seasonal deficit of a little over 10% on average.  The top precipitation map above shows that the dry signal is quite reliable near the south coast, but there is a discrepancy between the two precipitation maps over western Alaska.

What's the cause of these patterns?  The maps below show that years with La Niña during autumn tend to see an upper-level trough extending from the Arctic Ocean north of Alaska to southeastern Alaska in the subsequent winter, and sea-level pressure is usually higher than normal over the Bering Sea.  This configuration draws cold air down from the north more often than normal, and the relative absence of storminess in the Bering Sea and Aleutians translates into reduced precipitation over southern Alaska.  Another way to think of it is that the jet stream spends more time to the south of Alaska rather than bringing Pacific storm systems up into western and southern parts of the mainland.


How about wind speed?  The first map below shows the average departure from normal in similar past years, and it points to reduced wind on the North Slope and enhanced wind in the southern Alaska Peninsula and eastern Aleutians.  To highlight the signal over the interior, where average winds are mostly light, I added a second map to show the percent departure from normal.  The magnitude of the signal is very small, but a reduction in wind in the western interior is consistent with reduced storminess and - perhaps more significantly - higher pressure that tends to produce stronger inversions with calm, clear, and cold conditions.


Finally, snow depth - see below.  This is interesting: even though liquid-equivalent precipitation tends to be lower than normal around Bristol Bay, snow depth tends to be higher because of the cold (i.e. there's much less rain).  The same is true in parts of southeast Alaska.  But in much of the west, interior, and south-central Alaska, the ERA5 data suggests that below-normal snow depth is more common.


Much could be said about the extent to which historical station data support these results from the ERA5 product, but I'll leave that for another time.  To conclude, here's a hemispheric view of these climate variables, plus a bonus map for solar radiation at the end.  It's particularly striking to see that western Alaska has the most notable cold signal in the hemisphere, while the La Niña "hot spot" is in central Arctic Russia (where - interestingly - it has been excessively warm throughout this year so far).


Saturday, September 19, 2020

Sea Ice Minimum

Arctic sea ice has reached its seasonal minimum, and after a summer of exceptional warmth near the Russian coast, this year's minimum ice extent is the second lowest on record.  For only the second time in modern history, Arctic sea ice extent dropped below 4 million km2, but 2012 still holds the record for most open water in the Arctic Ocean.

Comparing the ice concentration images from 2012 and 2020, the situation is pretty similar, although more ice remains in the Beaufort Sea this year, and there's a larger area of reasonably high ice concentration in the central Arctic Ocean.  However, melt-out has advanced closer to the pole on the Russian side than in 2012; there is wide open water north of 85°N at 60°E, i.e. only about 300 miles from the pole.


It's interesting to consider how summer weather patterns affect the magnitude of ice loss.  Using the annual difference in ice extent between May and September to measure summer ice loss, the map below shows the correlation with June-August mean 500mb height over the last 20 years.  This reveals quite clearly that a negative phase of the Arctic Oscillation, involving higher heights (pressure) over Greenland and the high Arctic, is a pattern that favors more ice loss than the inverse (positive) AO phase.

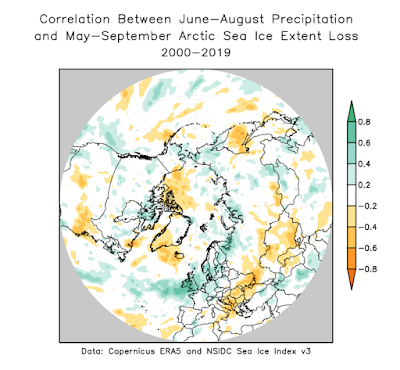
A negative AO also brings low pressure to northwestern Europe, and so it turns out that a wet summer in the British Isles is significantly associated with greater ice loss.  Here's the correlation map for precipitation (click to enlarge).

Did this summer fit the pattern for enhanced ice loss?  In a very broad sense yes, as there was a very notable ridge over the Arctic Ocean, but it wasn't aligned with the typical Greenland epicenter of the Arctic Oscillation, and the AO index was only slightly negative.  However, the trough over southern Alaska was quite characteristic of low ice years, and it was indeed quite a wet summer in parts of the British Isles - see below.


Below are the correlation maps and the corresponding 2020 anomaly for a few other variables.

Mean sea level pressure shows the Arctic Oscillation pattern very clearly, with a ring of low pressure around the Arctic margins surrounding the Greenland high pressure anomaly in a typical low-ice year.  The rather strong inverse correlation with MSLP over most of North America is interesting; I'm not sure what would explain such a widespread and apparently significant connection.

For temperature, eastern North America and of course most of the Arctic tend to be warmer when ice loss is large, but southern Alaska and western and northern Europe more often have a cool summer in these years.  This year didn't match these patterns particularly well, although July was exceptionally cool in northern Europe.


Finally, and perhaps surprisingly, solar radiation tends to be lower than normal across most of the Arctic except the Beaufort Sea in low sea ice years - at least based on these ERA5 estimates for the last 20 years - and 2020 certainly fit the bill in this regard.


If this is correct, it strongly suggests that clear skies and increased sunshine are not responsible when summer melt-out is large.  Rather, it seems to me that increased cloudiness would provide greater surface warming via increased longwave radiation, and this effect appears to be particularly important in the Eastern Hemisphere, where sea ice is more vulnerable with less thick multi-year ice.  The result also suggests that the ice albedo feedback may not be a significant factor in high melt years, although I'll admit that I'm straying outside my area of expertise here.

One final comment to make is that causation goes both ways when it comes to the typical weather patterns accompanying higher or lower sea ice loss.  Obviously, surface water temperatures can rise well above freezing once ice is gone, and near-surface air temperatures are no longer held down to the same extent.  Similarly, evaporation is much higher over open water than over ice, and this could explain greater cloud cover in low ice years.  So while I introduced this discussion as "how summer weather patterns affect the magnitude of ice loss", it's undoubtedly true that the weather in turn responds to the ice situation - and not just on seasonal time scales, but also in terms of longer-term trends.

Tuesday, September 8, 2020

Summer Over, But More Rain

Personal circumstances probably won't allow me to post much in the next few weeks, but I'll aim to make a few comments here and there as the season changes; and change it already has.  Frost was widespread across the central and eastern interior on Sunday morning, with the typically colder spots dropping well below freezing in completely normal fashion.  UAF's Smith Lake sensor dropped to about 25°F, but the airport only saw 34°F.  The normal date for first freeze at the airport is right about now.


Here are some of the minimum temperatures around the region (click to enlarge).


The frost followed a couple of chilly, damp days that were unmistakably autumnal, with temperatures stuck in the low 40s in the hills on Saturday.  Again, nothing unusual about that in itself.


What is unusual is the fact that measurable rain has fallen every day so far this month in Fairbanks: that's 8 days and counting after today's significant rain.  No other September (1930-present) has started off with more than 6 of the first 8 days with rain.

Here's a view of foliage up at Cleary Summit (2233' elevation) this afternoon.  Not as much color in the leaves as I expected, given the date; but it will be changing fast this week.


Wednesday, September 2, 2020

Summer Humidity

Last week reader Carl asked about humidity this summer in Fairbanks and suggested correctly that dry days were unusually absent.  This is an interesting point, so I created a chart to illustrate my earlier brief response: that the summer's lowest daily-mean humidity was higher than in any other summer in recent decades.  This is true both for relative humidity and dewpoint; there were only 3 days with (midnight-to-midnight) average relative humidity below 50%, and only 3 days with average dewpoint below 40°F.


Here's a more focused visualization of how this summer's relative humidity differed from the typical distribution of the past 20 years (click to enlarge).


As Carl noted, the lack of very dry days was notable, and correspondingly the number of days with 70-80% relative humidity was higher than normal.  Of course there is nearly always a marked increase in relative humidity as summer advances in Fairbanks, so the driest days are nearly all confined to June and early July, but nevertheless the chart gives a broad sense of the unusual shortfall in dry days this year.

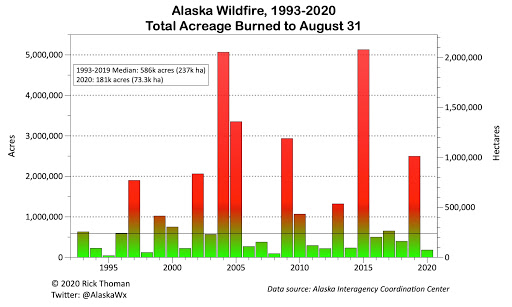
A rather obvious point to make is that low humidity strongly favors growth of wildfires, and so the absence of dry conditions this year is presumably one of the main reasons for the very low fire acreage.  Here's a superb fire acreage chart that Rick Thoman posted the other day.


Finally, while relative humidity was clearly well above normal this summer, dewpoint and atmospheric column-total moisture (precipitable water) were not as high as in some recent years.  Here's an update on a chart I showed back in 2017, when July humidity was extraordinarily high.  The upward linear trends since 1980 are statistically significant (p=0.05) for dewpoint in all three summer months, but interestingly not for precipitable water.