Thursday, September 30, 2021

Cold Deepens

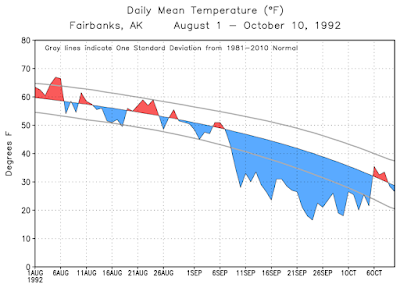
Faint echoes of September 1992 have been heard in the past week as cold has deepened over interior and southern Alaska, but despite the dramatic drop-off in temperatures, it really is only a shadow of the outrageous early cold that developed 29 years ago.  Here's a comparison of daily mean temperatures at Fairbanks:


Nevertheless, any comparison to 1992 is bound to fall short, and it's fair to say it has been notably cold for the time of year.  Yesterday Fairbanks failed to reach the freezing mark, and that's the first time a sub-freezing day has occurred in September since 1992.  In two recent years - 2015 and 2018 - it didn't happen until a full month later.

The week ending yesterday is also the coldest week in September since 1993 (not 1992), with a 7-day average temperature of 31.6°F in Fairbanks.  Judging from photos on Twitter, ice has formed on slow-moving sections of rivers.

The well-known interior cold spots of Chicken and Salcha (RAWS site) both saw their first 0°F readings on Tuesday.  Neither station was reporting in 1992, but for both sites this ties the earliest on record.

And here's a notable item from the north end of the Alaska Peninsula:


Here are the statewide temperature extremes this month: notice the expansion of the temperature range as cold develops over interior snow cover while southeastern maritime areas remain relatively mild.


Thursday, September 23, 2021

First Zero

I may start posting these NWS-Fairbanks information statements regularly, as they often provide nice summary tidbits, and those not on Twitter may not always see them.  (Note that the temperature later dropped to -4°F, -20°C, at Toolik this morning.)

--------------------------

Public Information Statement

National Weather Service Fairbanks AK

1207 AM AKDT Thu Sep 23 2021

...Fall Arrives In Northern Alaska With Below Zero Temperature...

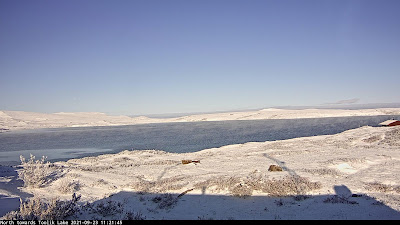
The first day of fall, on Wednesday, was greeted by a temperature of 1 degree below zero at the Toolik Lake Field Station, on the North Slope of Alaska, just north of the Brooks Range. Toolik Lake was also reporting over 3 inches of snow.

--------------------------

The current webcam view shows some steam fog over the lake, and what looks like a patch of newly formed ice.  What a beautiful scene!


Wednesday, September 22, 2021

Snow Totals

Eastern interior locations from the Tanana to Yukon valleys were the big winners in the early snowfall of the last couple of days, with as much as 9" reported in Tok.


According to the NWS, this morning's reported snow depth of 7" in Eagle is the highest on record for this early in the season, although Rick Thoman notes that the depth seems a bit too high for a 2-day accumulation of 7.5"; one would expect more compaction than that.

Here's a map of reported snow depths today across the southeastern quadrant of the interior.


And courtesy of Rick Thoman, snow cover is suddenly quite extensive, although it's unlikely to last in valley-level locations south of the Brooks Range.


Returning to the cold in Bettles, the high temperature on Monday was only 32°F, which is quite notable for so early in the season, although the rate of seasonal cooling is extremely rapid.  1992 and 1996 saw freezing days about a week earlier (September 14), and 2013 was also notable for early cold (32°F high on the 21st).  Typically it takes until about the first week of October to see a sub-freezing day in Bettles.


Monday, September 20, 2021

First Snow

The dramatic pace of seasonal change is making itself felt across interior Alaska today, with noon temperatures not far above freezing in many valley locations, and light snow showing up in some places.  A light accumulation was observed at UAF this morning, and it appears that a more significant snowfall is occurring just east of Fairbanks today.


Temperatures dropped into the single digits Fahrenheit in the Brooks Range this morning, including +3°F at Anaktuvuk Pass and +4°F at Toolik Lake.


Bettles is sitting at 27°F at 1pm, and it will be interesting to see if they make it above freezing today.  The earliest date in September that failed to do so was the 14th, in the great September cold snap of 1992.  There's no snow on the ground yet at Bettles, but it looks like Coldfoot has a modest snow cover already.


Saturday, September 18, 2021

Simulated Rainfall Extremes

A couple of months ago, I was involved in a discussion with several UAF climate scientists on the topic of "black swan" climate extremes for Alaska.  We saw the incredible heat wave unfold in late June across southern British Columbia and Washington state, and the question arose: can we estimate what kind of conditions would occur in Alaska if a similarly rare climate extreme occurred - whether in terms of heat, cold, or precipitation.  We're talking about truly rare extremes that shatter previous records by large margins.

One way to tackle the problem is to use simulated climate data from models, and so I've taken a look at rainfall data from a long history of simulations using NOAA's flagship GEFS ensemble model.  To help determine bias and skill in the model, NOAA has helpfully provided 20 years of retrospective forecasts, with 11 ensemble members initialized once per week in 2000-2019, and running out to 35 days in the future.  I used the portion of the forecasts for lead times greater than 10 days so that there's not much correlation between the 11 members, and this amounts to 20*52*11*25 days of synthetic climate, or about 785 years.

Based on all this data, here's the largest 24-hour precipitation total in the entire 785 years.  Note that the data is available at 6-hour increments, so this could be e.g. 6am-6am, or midnight-midnight, but peak 24-hour amounts would be a bit higher if hourly data were available.


The maximum is about 3.7" in Fairbanks, which is only slightly higher than the actual (historical) calendar-day maximum of 3.42" in August 1967 (3.28" at the Ag Farm).

Here's the largest 7-day total, with coincidentally again a very close match between the 785-year simulated maximum (6.1") and the August 1967 values (6.1" the airport, 6.2" at the farm).  Of course the GEFS model is not simulating the 1967 flood, it is simply creating lots of scenarios for the 2000-2019 climate.


With 785 years of synthetic climate, we can estimate a 100-year recurrence value by taking the 8th highest value.  Here's a comparison with the historical period-of-record maxima for 2-day and 7-day totals at four climate sites that have approximately 100 years of observed data.

2-dayGEFSObserved
Fairbanks3.4"4.3"
Utqiaġvik1.7"1.4"
Nome4.2"3.0"
Yakutat12.5"13.7"

7-dayGEFSObserved
Fairbanks5.1"6.1"
Utqiaġvik2.3"1.9"
Nome6.3"5.3"
Yakutat18.5"20.6"

All in all, the comparison is quite favorable, suggesting that the model's representation of precipitation extremes may be fairly realistic.  This then suggests that perhaps the 785-year maximum values may not be too far off what we might expect in the current (recent) climate for a return interval of about 800 years.

In turn, we might conclude that the August 1967 flood in Fairbanks may well have been something close to a 1000-year flood.  The 2-day and 7-day GEFS 785-year maxima are 4.7" and 6.1" respectively, compared to 4.3" and 6.1" for the observed period of record.

Interestingly, the NOAA precipitation atlas shows 500-year recurrence values of 5.3" and 6.9" for 2-day and 7-day totals in Fairbanks, which represents somewhat higher extreme values than the GEFS data shows.

Next up - I hope to look at extreme maximum and minimum temperatures in the GEFS model data.  What would a "black swan" heat wave look like in today's climate?  Stay tuned for an answer.

Sunday, September 12, 2021

August and Summer Climate Anomalies

Time continues to elude me for more frequent posts, but here's a look back at statewide climate anomalies during August and for the summer as a whole.

First, the NCEI climate division data indicate that August was the coolest summer month - and the coolest relative to normal - since August 2015.  The statewide average temperature of 49.4°F was about 1°F below the 1991-2020 normal, but would have been slightly above normal prior to the 1980s.  Precipitation was significantly above normal statewide, but unlike June and July the wet anomaly was across the interior and southeast, not along the west coast.


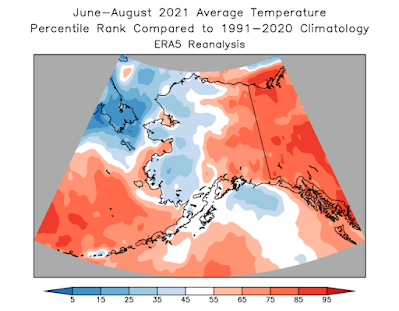
Here's the same view from the ERA5 reanalysis:


And here are Rick Thoman's excellent station-based graphics for comparison:


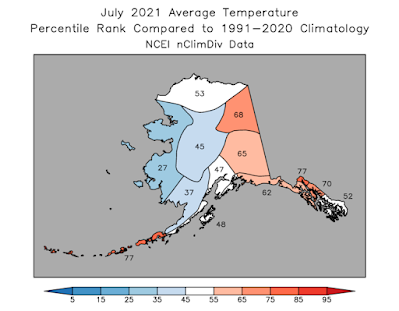
This month there isn't a major discrepancy between NCEI and ERA5 for the North Slope (see last month's post for discussion), and the NCEI numbers for July have been revised.  The updated map shows a much warmer July for the North Slope, although still not as warm as ERA5:


The maps below show the ERA5 ranks for several variables for the summer as a whole.  The big story is the excessively cloudy and wet conditions in much of western Alaska, although it wasn't terribly cool compared to the long-term normal.  The pattern was caused by a very persistent trough that was stuck between a pair of high pressure ridges over Siberia and over southwestern Canada and the western lower 48.


Thursday, September 2, 2021

Subdued Fire and Lightning Season

Fire-prone parts of Alaska have enjoyed a bit of good news this summer in terms of lightning and wildfire activity, which were both below normal statewide.  Of course there were some significant fires - notably the Munson Creek Fire near Fairbanks and the Dry Creek fire near Manley Hot Springs - but the total fire acreage was quite low: less than half the 1995-2020 median.


The total fire acreage of about 250,000 acres is a small fraction of the multi-million acre outcomes in the most active recent years, such as 2019, 2015, and 2004-2005.  Here's an excellent graphic from Rick Thoman.


Below is a map of fire perimeters (click to enlarge).  The Munson Creek and Dry Creek fires were the two largest, both about 50,000 acres, and the Cultas Creek fire near the upper Yukon burned about 40,000 acres.  There was also a 30,000 acre fire adjacent to the Nabesna River south of Northway.  Another noteworthy one was the Noatak River fire, which burned 19,000 acres in the Noatak preserve of the western Brooks Range - above the Arctic Circle. 


Not surprisingly, total lightning also ended the season well below normal, with only 2018 having a lower strike count in the history of the modern detection network.


Here's a large part of the reason why: unusual low pressure over the Chukchi and Beaufort Seas, creating a more westerly flow regime than normal for the time of year.  The reanalysis map below shows the rank of the June-August average MSLP relative to the climate of the previous 60 years; the MSLP was easily in the lowest 10% of the historical distribution over a wide area, and was estimated to be 2nd lowest in some areas off the north coast of Alaska.  Obviously this pattern was also the cause of the very wet and cloudy summer in western Alaska.