Sunday, February 26, 2023

Snow and Snow Ratio

Fairbanks has seen a fair bit of snow this month, with measurable accumulation on 16 days and a total of 20.6" so far.  The record number of days with accumulating snow in February was set just last year, at 18 days.  The long-term median February snowfall is just 7 inches.  However, we're nowhere near the February 1966 record of 43".

It's interesting to note that this is now the 7th consecutive February with above-median snowfall, including 5 of 7 with over 20".  Remarkably, only 7 of the preceding 87 years (since 1930) had this much snow in February.  It used to be rare - fewer than 1 in 10 years - but is apparently now common.

Last Thursday's snowfall of just under 6" contained nearly half an inch of liquid equivalent, so it was fairly dense stuff by interior Alaska standards.  This got me thinking about snow ratios and the long-term trend thereof.  Is there any evidence that the snow ratio (total snowfall divided by liquid-equivalent precipitation) has changed over time?

Yes, absolutely: the last decade or so has seen generally lower snow ratios than in the previous six decades, and there have been no winters with a historically high ratio (e.g. over 20) since 2009-10.  Last winter had the lowest ratio on record for Fairbanks, only 10.5, and a large reason for that was of course the epic rain storm of Christmas 2021.

It's interesting to see that mostly low ratios also prevailed in the 1930s and 1940s, although I suppose there's a chance that different measuring practices could explain at least some of this.  However, we know there were some notable, indeed extreme, winter rain events in the 1930s, so a regime of low ratios is perhaps not unexpected.

The recent decrease in ratios is more noticeable for November-December than for January-March, although the absence of high ratios clearly stands out for both:

The low ratio in Nov-Dec 2010 reflects the exceptional rain event of that time - as documented here in the early days of this blog:

http://ak-wx.blogspot.com/2010/11/rain-records-again.html

As for the low ratio in January-March 2016, that reflects the extraordinary rain at the end of March, which produced as much precipitation as the rest of the (very dry) 3-month period combined.

A decrease in snow ratio is what we would expect if the atmosphere is warming overall.  Snow tends to be more dense at higher temperatures, and of course increased warmth favors occasional winter rain, which crushes the total snow ratio.

The ERA5 global reanalysis (model) also shows signs of a change since 2010-11, with most years having a lower ratio of total snow water to total precipitation - see below.  This is not the same thing as snow ratio, as it's only affected by the rain vs snow partition, and not by snow density - so the ERA5 is just showing an increased frequency of significant winter rain.  It would be highly worthwhile to look at the spatial distribution of this change in the model data.


Wednesday, February 22, 2023

Weather Contrast

The weather has been bad today in western Alaska, with wind, snow, and rain moving up from the south.  Kotzebue developed a white-out this afternoon with 40-50 mph winds.


But far to the east on the other side of the ridge axis, it has been a stunning day (after a chilly start) in eastern Alaska and the Yukon, with lots of glorious sunshine.  Here's the webcam view from Dawson:


And in video format:


Here's the 3am 500mb analysis, courtesy of Environment Canada: click to enlarge.  Note that ridge axis right over Alaska.


Monday, February 20, 2023

Follow-Up on La Niña

It's worth following up on a couple of points from last week's post.

First, to extend the comments on what happened in January, the Arctic as a whole did not see the widespread and unusual warmth that affected Alaska, although conditions were highly variable across the basin:

The European side was even warmer than the Alaskan sector, but much of inland Arctic Siberia was colder than normal.  I say "inland" because the most northerly Russian sites around 90°E were much warmer relative to normal, illustrating the moderating influence of the ocean despite its ice cover.

The relationship between ENSO and winter temperatures is not as simple for the Arctic as a whole as it is for Alaska, because there are strong regional differences across the Arctic.  The Arctic-wide temperature trend since 1980 is similar for both El Niño and La Niña, judging from the 32 sites I've been using for realtime monitoring:


Notice that of the three extremely warm winters of 2015-16 through 2017-18, one was an El Niño winter, one a La Niña, and the other one was neutral.  

The neutral-ENSO trend is slightly less than the El Niño and La Niña trends, which is similar to the result I showed last time for Alaska.  But let's discuss that result a bit more.  It turns out that the neutral-ENSO temperature trend is very sensitive to the ENSO classification method, i.e. which index we use to determine whether a winter is El Niño, La Niña, or neutral.  Last week I used the Multivariate ENSO Index, which is a comprehensive measure of ENSO's expression in several different variables.  This was the result for Fairbanks:


In contrast, here's the analysis using the Southern Oscillation Index to define the occurrence of El Niño and La Niña.  The SOI is a simple but venerable index based solely on pressure differences between Darwin (Australia) and Tahiti.


What a difference this makes to the neutral-ENSO trend!  It now shows no significant discrepancy from the El Niño and La Niña trends, and all three are similar.  The trends are also quite similar if we use data back to 1930 (the SOI is available back into the 19th century):


How could the ENSO classification method make such a large difference?  Part of the answer is that these linear trend estimates are inherently uncertain (as I noted last time) because of the small sample size in each category, and the large year-to-year variance.  And in particular, the classification of neutral-ENSO years is subject to considerable uncertainty, because the phase estimate can differ in either direction.  In contrast, the stronger El Niño and La Niña episodes are unambiguously classified with more confidence.

As an example, it seems that three very warm winters in the first half of the MEI series were classified as neutral ENSO winters according to the MEI, and all three had a significantly positive PDO phase: 1969-70, 1976-77, and 1980-81.  The warmth in these earlier years contributes to the lack of warming trend in the ENSO neutral category:

But according to the SOI, all three winters were marginally El Niño winters, and so they are excluded from the neutral-ENSO trend calculation.


Similar differences are found for the statewide Alaska temperatures, and remarkably the situation is now reversed with the neutral-ENSO trend, which is now the steepest of the three:

Another interesting point here is how much more shallow the long-term trend is when including the data prior to 1950.  Starting the trend in 1950, as I did for the MEI classification, produces very steep trends because of the cold (negative PDO) era of the 1950s and 1960s.

In conclusion, there's obviously very large uncertainty around the neutral-ENSO trend, but the SOI classification supports the consistency in Alaska's warming trend for both La Niña and El Niño winters.


Monday, February 13, 2023

What Happened to La Niña?

A few days ago, reader Gary commented on the relatively warm winter that Alaska has had so far, and asked about the status of La Niña.  It's worth considering this, because La Niña is still ongoing in the equatorial Pacific Ocean, and La Niña tends to produce cold winters in Alaska (but not always, of course).

The current La Niña - which is now waning and is likely to dissipate this spring - has been a strong one, and this is the third La Niña winter in a row.  The chart below shows the Multivariate ENSO Index since 1950; the MEI is the single most comprehensive index we have to measure the behavior of La Niña and El Niño:


Neither of the two past winters was particularly cold for Alaska as a whole: only November was notably cold last winter, and February was the only month with significantly unusual cold in winter 2020-21.  Both winters ended up close to the 1991-2020 average, judging by the November-March average for the state overall.

But this winter we've seen not just an absence of cold but a considerable degree of warmth, particularly in January.  It was the 4th warmest January since 1990, and the 2nd warmest since 1950 for a La Niña winter (based on MEI data since 1950).


Here's a chart of November-January statewide average temperatures since 1950, with the ENSO classification indicated by colors.  For the classification, I simply divided the Nov-Jan MEI index into equal thirds.

There are several remarkable things to notice here.  First, this winter so far (the right-most blue marker) has indeed been much warmer than the average La Niña winter of the past 70 years, although winter 2000-2001 was much warmer still; it's not unprecedented for La Niña's cold signal to "fail" completely.

Second, the linear trend lines denote the changing "normal" for the three ENSO categories, and we see that this winter (through January) has been as warm as the typical El Niño winter would be in the current climate.  (Note that last winter was cold for Nov-Jan, but warmth in March largely reversed that anomaly for the overall winter average.)

Third, it's very interesting to see that neutral ENSO winters seem to have warmed much less than either El Niño or La Niña winters.  We see the same result in a chart for November-March (of course this winter is not yet plotted here):


According to this analysis, neutral ENSO winters are now just as "cold" as La Niña winters.  Interestingly, there's also a suggestion that neutral ENSO winters used to be the warmest of the three categories, although the uncertainty is large on these linear regression estimates because of the small sample size in each category, and the large year-to-year variance.

The surprising difference in the neutral-ENSO trend is accentuated even more if we only use data since the 1976-77 Pacific climate shift, when Alaska winters suddenly warmed up in association with the PDO phase reversal.  In this short and highly uncertain trend analysis (see below), the neutral-ENSO trend is negative, but that's clearly because the very warm winters of the late 1970s and the 1980s saw a lot of ENSO-neutral conditions.  We would probably wish to avoid attributing the warmth back then to the neutral ENSO state, because the persistently positive PDO regime likely had more to do with it.


The temperature data from Fairbanks tell a very similar story: November-January this winter was as warm as a "typical" El Niño winter; winter 2000-2001 was much warmer still; and neutral-ENSO winters have warmed much less than either El Niño or La Niña winters.


Incidentally, it's interesting also to see the consistency between the independent trend estimates for La Niña versus El Niño winters.  There's a hint that El Niño winters have warmed slightly more than La Niña winters, but there's not much in it.

Here are some other climate ranking maps for January: it was relatively wet for the eastern and northern parts of Alaska, significantly less windy than normal in much of the south and west, and cloudier than normal almost everywhere.


Sea-level pressure was below-normal across the Bering Sea and most of Alaska, which explains the relatively cloudy, damp, and warm weather.  La Niña winters more typically see above-normal MSLP in the Bering Sea and Aleutians.


La Niña also more commonly brings low MSLP to the Arctic, and therefore a positive AO phase, but the AO remained negative in January (although much less so than in December).  The enhanced north-south pressure gradient produced above-normal winds for the Arctic coast: UtqiaÄ¡vik appears to have had one of its windiest Januarys on record.


Monday, February 6, 2023

Winter of 1905-06

"The days were much lengthened now, and the worst of the winter was done.  There would still be cold and storm, but hardly again of the same intensity and duration."

So wrote the worthy "archdeacon of the Yukon", Hudson Stuck, in his 1914 account of "Ten Thousand Miles with a Dog Sled".  I recently acquired a copy and would highly recommend its splendid descriptions of the winter environment of interior Alaska as well as its admirable study of both native and non-native inhabitants of the time.


The first section of the book gives a detailed account of a 2200 mile circuit in the winter of 1905-06, taking four and a half months, from Fairbanks to the Kobuk River and Kotzebue, then to Nome, and then back to the Yukon River via Unalakleet and finally back up to the Tanana River and Fairbanks.  Stuck's account of the weather is remarkable reading, because it just so happens that the winter of 1905-06 produced some of the most severe cold in the recorded history of interior and northern Alaska.  He got into trouble quite early on the trip, unwisely starting out on the leg from Circle to Fort Yukon with an inexperienced guide and the thermometer at -52°F.  Of course we know Stuck was a man of remarkable strength, as he co-led the first group to summit Denali in 1913, but nevertheless his experience of the episode near Circle is almost beyond belief:

"We had been out about twenty hours in a temperature ranging from 52 to 60 below zero, had walked about forty-four miles, labouring incessantly as well as walking, what time we were with the sled, with nothing to eat - it was too cold to stop for eating - and, in addition to this, one of us had been in water to the waist, yet none of us took any harm."

It's interesting to compare Stuck's observations on the trail to the temperature observations that were made at the three central interior sites that were operative that winter: Tanana, Rampart (about 60 miles up the Yukon from Tanana), and Fairbanks.  It was the first winter of mostly complete temperature measurements from both Rampart and Fairbanks.

Right off the bat we notice that Tanana reported -70°F on three days in January 1906, and only three such days have ever been recorded there subsequently (two in 1947, and the famous -76°F in 1989).  As for Fairbanks, the -64°F on January 19, 1906 has only been exceeded by the -66°F in 1934.  And the rather short period of record from Rampart (1900-1933) has no other winter with as many days reaching -60°F (8 days in January 1906).

The charts below show the reported daily high and low temperature for the three sites.  Stuck reached Circle on December 6, and made the decision to leave on the 7th despite the cold.  Clearly Stuck's thermometer was more or less correct, as Fairbanks reached -60°F on the 7th; this is tied for earliest on record for such cold in Fairbanks.


Stuck had intended to spend Christmas at Bettles, 250 miles up the trail from Fort Yukon, but ended up spending the holiday in a village on the Chandalar River to provide assistance during a diphtheria outbreak.  He departed on the 27th: impeccable timing with respect to the next cold snap at the end of December.  Temperatures of -40° to -50° were seen for much of the time until his arrival in Bettles on January 12.

The archdeacon then reports that the temperature never rose above -50° for two weeks in Bettles, delaying any further progress in that time.  Looking at the charts above, it's clear that there was in fact a brief interlude in mid-January when the central interior saw warmer conditions, but Bettles is quite a long way from Tanana, Rampart, and Fairbanks.  It's possible that a few days of cloud cover produced the warm-up farther south, while Bettles stayed locked in the cold.  Stuck describes the weather as "of quite exceptional severity" and even reports a rare occurrence of wind blowing at -58°F.

Finally, on January 26, Stuck judged that the cold snap was over, based on a downward trend of the barometer: "the barometer had been falling slowly for a couple of days, and I was convinced the cold spell was over".  This proved to be correct, as there was no more severe cold that winter, and indeed March turned out to be extremely warm, causing difficulty of another kind for Stuck's return journey.

What was going on with the weather patterns in January 1906?  It seems there was an abundance of high pressure over Arctic Russia, and we know that there was persistent low pressure near Iceland (positive NAO phase).  Here's the estimated MSLP anomaly from the 20th Century Reanalysis:

Monthly Weather Review reports that "Temperatures below the average were reported from Yukon Territory and the extreme northern districts of British Columbia, but in all other portions of Canada the normal was exceeded, and in many localities to a very marked extent."

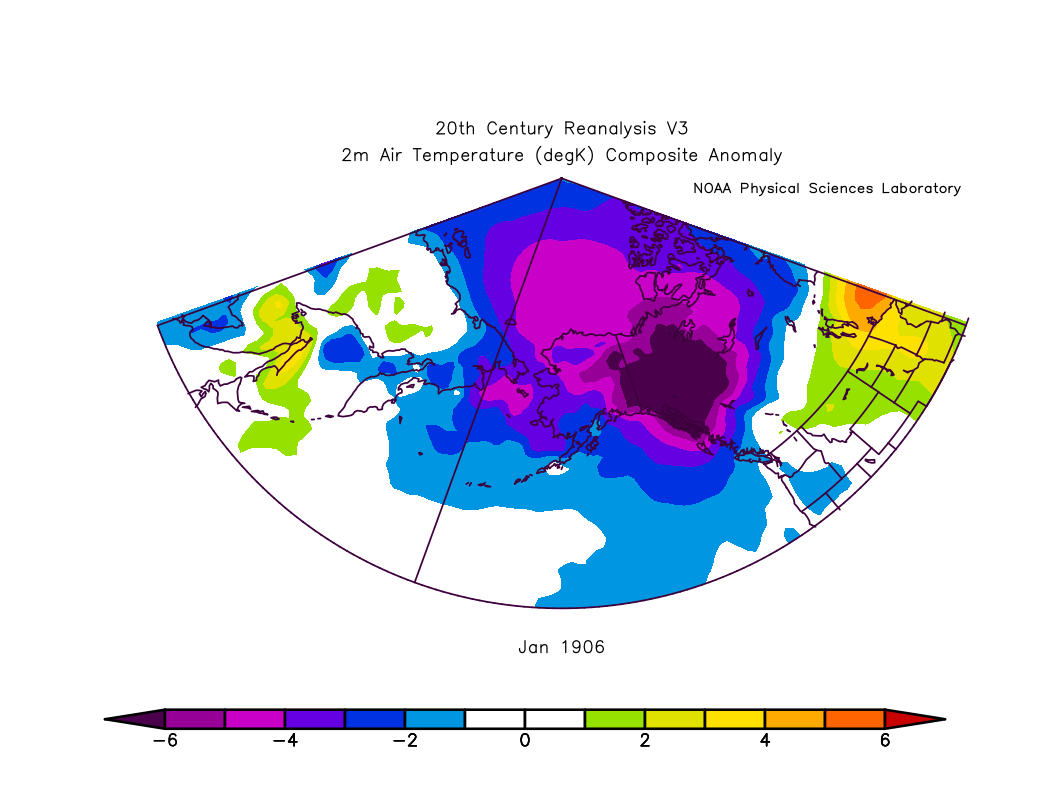
My interpretation is that the pressure gradient across the Arctic basin transported cold Siberian air masses into Alaska, and there was a persistent but localized trough over western Canada.  The 20th Century Reanalysis indeed shows this pattern, which is pretty classic for winter cold in Alaska.


However, the model doesn't quite capture the magnitude of the cold for interior and northern Alaska - see below.  This isn't surprising, as to my knowledge the model only uses surface pressure and sea surface temperature measurements to construct its estimate of past conditions; the surface temperature data are not fed into the model.  Evidently the model doesn't quite have the trough in the right position, or perhaps its physics are inadequate to produce the surface-level cold that actually occurred.


Could something like this happen again?  Yes and no.  Given the right seasonal climate influences and random chance, a similar circulation pattern could probably recur in the modern climate, bringing an intense focus of extreme cold to Alaska for weeks at a time.

But I think that even the coldest sites are very unlikely to see cold as extreme as January 1906 in the coming centuries, because of the increase in high-emissivity gases aloft, primarily CO2 and water vapor.  Extreme cold in interior Alaska occurs in a very thin layer of air at the surface, and so a "small" change in the composition of the air aloft makes a big difference.  Taking Tanana as an example, there hasn't been a single instance of -65°F since 1991, whereas it apparently occurred 22 times from 1903-1947, and 11 times from 1948-1991.

So - hats off to Hudson Stuck, who seems to have come through it all unscathed: a remarkable man, in remarkable circumstances.