Tuesday, January 30, 2024

Airmass Contrasts

[Hat-tip to Brian Brettschneider for pointing out the event discussed below.]

Yesterday I highlighted the strong southerly flow across central and eastern Alaska that raised temperatures aloft up to near the freezing point above Fairbanks.  Elevated locations in the Yukon-Tanana uplands and the Alaska Range experienced this warmth directly: take a look at yesterday's high temperatures between Delta Junction and Glennallen (click to enlarge).


An automated site just above 5000' elevation (Look Eyrie) overlooking Isabel Pass (3600') rose to 36°F around noon:


But below about 3000' on the north side of the Alaska Range, the warmth didn't break through.  Here's the chart for a site at 2430' (Black Rapids Chalet) just to the north of the Richardson Highway pass: notice the high temperature of -17°F yesterday.


In the roughly 10 miles and 1000' elevation between this site and the pass, the back-and-forth "slosh" of the dense surface cold air produced remarkable swings in temperature yesterday evening.  The following chart is from the Black Rapids FAA site less than 2 miles up the road, and just 250' higher:


Check out the alternating wind direction and temperatures between 9pm and midnight (click to enlarge):


Warm air broke through 3 separate times, with the temperature dropping back to -10°F or lower between each episode!  Then finally the cold northerly flow won out by midnight, and the temperature re-stabilized below -20°F, with quite a wind chill (wind speed up to 35mph).

Up at the pass, a single warm episode occurred, with the temperature holding not far below freezing for more than 5 hours in a southerly breeze; then the wind reversed and the temperature dropped an amazing 42°F in 10 minutes.  In reality one can imagine the temperature drop being almost instantaneous as the boundary passed: air masses of such different density are nearly immiscible, like oil and water - hardly mixing at all.


Similar events occurred about 15 miles to the south, at Fielding Lake (elevation 3000'):


Here's the surface/MSLP analysis at 3pm, courtesy of Environment Canada.


Low pressure was pushing up from the Gulf (producing another big snowfall in Anchorage), and the impulse associated with this storm is what drove the temporary warm air intrusion across the higher elevations.

What an interesting meteorological event!

Monday, January 29, 2024

Cold Moves West

The axis of the cold trough aloft has shifted westward in the past couple of days - towards a more climatologically favorable position - and therefore southerly flow has developed across the central and eastern interior, bringing clouds, widespread light snow, and relatively warmer temperatures.  This morning's 500mb analysis:


Accordingly, the core of the surface-level cold has moved to western and southwestern Alaska.  One of the more notable cold spots this morning was Unalakleet on the Norton Sound coast: the temperature dropped to -45°F with a light southeasterly breeze as cold drained out of the interior.  This appears to be the lowest temperature in Unalakleet since February 1999.  The all-time record there (with data since 1941) is an almost unfathomable -59°F, which occurred almost exactly 35 years ago during the great 1989 cold snap.  A number of interior spots dropped into the -70s in that event, making the current cold snap look paltry.

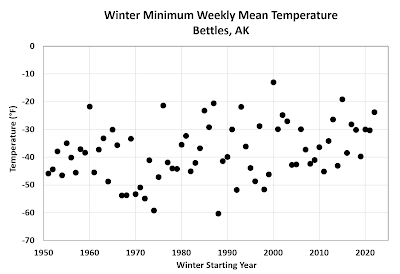
There's more cold to come later this week as an arm of the trough reloads over eastern Alaska, but so far the coldest readings I've seen are -57°F at Fort Yukon, Bettles, and the Norutak Lake RAWS; -58°F at Tanana; and -59°F at the Allakaket FAA site.  (As an aside, the North Pole 1N co-op site has been reporting ridiculous numbers below -60°F and is not credible at all.)

So far I've not seen a daily high temperature of -50°F or lower.  Bettles came close yesterday, with a daylight high of -50°F, but clouds rolled in before midnight, lifting the temperature by a full 20°F after dark.

Here are some of today's low temperatures (the online map is too large to fit in one screen capture): 


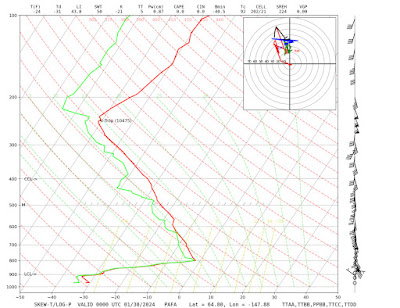
One more interesting note: the deep southerly flow aloft has brought temperatures to nearly the freezing point a few thousand feet above the surface, as seen in this afternoon's sounding from Fairbanks:


The 32.4°C temperature inversion between 916mb and 800mb is one of the greatest inversions ever observed in the history of Fairbanks soundings.  The all-time record (data since 1948) is 33.4°C, observed in December 1956 and February 2018.  Here's my post from the 2018 event:


Saturday, January 27, 2024

Cold Snaps in El Niño

The cold snap appears to be reaching its nadir this weekend for the western and northern interior.  This morning's temperatures bottomed out in the -50s Fahrenheit for many locations from as far south as Nikolai up to the Kobuk River valley and eastward to the Yukon Flats.  The coldest spots in Fairbanks-land dropped to near or just below -50°F, although the airport only made it to -40°.

With more than a month having passed since the solstice, afternoon sunshine allowed for temperatures to recover somewhat this afternoon, but less so in the northern interior, and Bettles saw a high temperature of -47°F.  It's fairly late on the calendar for this: the latest date in Bettles with such a cold high temperature is February 3rd (1993).

This morning's 500mb chart from Environment Canada shows the mid-atmosphere situation, with a deep, cold trough over central and northern Alaska.


This afternoon's 500mb height of 4950m on the Fairbanks sounding is the lowest in 7 years.

I mentioned the other day (prompted by Rick Thoman's comment) that really significant cold snaps are relatively uncommon during El Niño winters.  Here's a look at some data to illustrate that point: the chart below shows each winter's lowest weekly (7-day) mean temperature for Fairbanks and Bettles combined (i.e. the average of the two sites).  The colors indicate El Niño or La Niña winters, as defined by the December-January Multivariate ENSO Index being above +0.5 or below -0.5 respectively.


It's clear that for the seven decades as a whole, La Niña winters have tended to produce colder cold spells, although admittedly the evidence is only compelling from about 1980 through 2010.  In the 1950s, 60s, and 70s there were some nasty cold spells with El Niño, and in recent years La Niña hasn't produced anything like the cold that it used to.

The result is similar if we classify years based on the Oceanic Nino Index, which uses only Niño3.4 SSTs as an index of ENSO strength.


Either way, we find a difference of about 5-6°F on average between the coldest weeks in El Niño versus La Niña winters; but there is obviously a lot of variability between winters, and from decade to decade.

The disappearance of the most severe cold in recent decades is remarkable.  Here's a chart showing all winters:

The current cold snap will break the sharp uptrend, but perhaps only marginally; we'll see.

The Fairbanks urban heat island is certainly a factor here, but the trend is only about 20% greater for Fairbanks than it is for Bettles (+1.8°F/decade vs +1.5°F/decade for the coldest weekly temperatures).


Wednesday, January 24, 2024

Huge Snows in Juneau

Back in November, Anchorage saw a remarkable snow onslaught (38" or so) that amounted to the 3rd greatest on record for a time scale of 10-14 days:


https://ak-wx.blogspot.com/2023/11/a-few-notes.html

Juneau has now countered with a yet more extreme snow situation, with two huge storms in the space of 10 days, and a 12-day total of 64".  This is the greatest snow accumulation on record for windows of 11-18 days, and it's well ahead of the previous record for 12-day snowfall:


The latest 3-day total of 34.5" at Juneau airport is itself the 3rd greatest on record, exceeded only by storms in 1963 and 1966.  Even higher amounts were reported from other locations, including 48" around the corner on Taku Inlet.

According to the NWS, "Juneau Docks and Harbors Department reported several boats capsized or sunk by weight of the snow".

The key aspect of the weather setup seems to have been a near-stationary frontal zone draped across Southeast Alaska: below are the surface analysis charts from 3pm Sunday, Monday, and Tuesday respectively.  Notice the long stationary front marked on the top image and resurrected on the last image, with broad areas of low pressure over the Gulf and modest high pressure to the east and north.


A slow-moving weather situation is obviously a prerequisite for prolonged periods of heavy precipitation.  It also seems clear that the relatively weak nature of the Gulf low pressure was a key factor, because the warm southerly flow wasn't strong enough to drive out low-level cold air, and precipitation remained in the form of snow longer than expected.  A stronger, more dynamic Gulf storm would have quickly swept warm air into the Panhandle and produced rain instead.

From the NWS Juneau discussion on Tuesday afternoon:

Southeast Alaska Forecast Discussion
National Weather Service Juneau AK
332 PM AKST Tue Jan 23 2024

.SHORT TERM...Winter weather continues for places north of the
Icy strait corridor while places to the south continue to see
rain. Temperatures this afternoon have been slow to warm up,
especially those still under the influence of outflow winds. Model
guidance continues to try and warm up locations that are
currently seeing snow but observations continue to show cold air
remains. A wave moving up from the south has started to enter the
panhandle bringing a reinforcing shot of moisture to the area.
This wave could also bring a surge of warm up form the south to
the north as well. The big question with this remains are the
winds associated with it strong enough to mix out the surface
inversion that has allowed us to see snow. Current thinking is
that we will see a slight warm up with this wave but that it will
not be strong enough to mix out the cold air. With that being the
case, the Juneau area is expected to continue to see snow. If the
wave does succeed in mixing out the surface inversion, the snow
will switch over to rain fairly quickly. The current forecast
tried to reflect this possibility of staying snow for longer and
the winds failing to mix out the inversion until tomorrow.

Tuesday, January 23, 2024

Cold Snap Begins

A significant cold snap is getting under way for interior and northern Alaska, and computer models show it deepening and intensifying in the coming days.  Here's the latest ECMWF ensemble mean 500mb height anomaly forecast for Saturday afternoon, showing a deep trough with a very cold Arctic air mass parked over Alaska:


By this weekend the air aloft will be much colder than what's currently in place, even though surface temperatures dropped into the -40s in many eastern interior locations this morning.  The initial round of cold has been generated by surface-based cooling (clear skies, calm winds) with a strong inversion: here's the 3am sounding from Fairbanks today.


The cooperative observer at North Pole 1N reported an impressive -49°F this morning, while Fort Yukon dropped to -50°F.  -48°F was measured over in Eagle, and Chicken saw -52°F.  It looks like these numbers will be exceeded without difficulty over the next week.

If we do end up with a historically significant cold spell, it will be quite unusual for an El Niño winter; Rick Thoman notes the possibility of the longest winter cold spell during El Niño since January 1973.  That was a good one: 15 consecutive days with -40° or lower in Fairbanks.


Thursday, January 18, 2024

Bering Sea Ice

Rick Thoman put up a post about Arctic sea ice earlier this week, and it's well worth reading, as usual.

https://alaskaclimate.substack.com/p/arctic-sea-ice-update

Recent warm weather across the Bering Sea has prevented new ice growth since the turn of the year, and the latest daily ice extent number from NSIDC is nearly 20% below the median of the last 30 years.  However, we're still some way above the low ice conditions of 2015 and 2017-2018; compare the latest daily map to the same date in 2018:


Here's a look at daily temperature departures from normal since October 1st for Nome, Bethel, and St Paul Island:


December was quite chilly, as I noted here, but the rather persistent warmth since then has become a more significant and long-lived anomaly.

It's not really surprising, of course: the northwestern North Pacific is so warm, and across such a wide area, that winds from the south and west are bringing air with higher temperatures than normal.  Here's the average vector wind at 850mb since January 1: lots of southerly flow across western Alaska.


And here's the global sea surface temperature analysis from December, expressed in terms of standardized departure from normal (to reveal the local significance of the anomalies).


Sunday, January 14, 2024

Polar Vortex

Alaska's first -50°F measurement of the season occurred on Thursday in the well-known cold spot of Chicken, up at 1800 feet of elevation in the Fortymile country.  It's been chilly in the Yukon Flats too: well into the -40s in places.  In an interesting reversal of the December situation (when it was warmer to the east), this cold in eastern Alaska is just the western margin of an impressive cold pool across the border in Canada.

The cold across Canada is associated with a deep mid-atmospheric circulation that is sometimes (and controversially) known as the "polar vortex", and its migration across western Canada and then down toward the lower 48 has generated plenty of headlines.  Here's what it looked like in the 500mb analysis (courtesy of Environment Canada) at 3pm Friday:


Notice the sharp but strong ridge over Alaska, toward the top left of the image.  Here's a hemispheric view of 850mb (lower troposphere) temperatures at about the same time, with North America on the left:


The coldest air mass in the hemisphere was over western Canada - even colder than over Siberia - but parts of Alaska had 850mb temperatures above freezing at the same time.

Yesterday afternoon's surface analysis shows a vast area of high pressure from Greenland and the western Canadian Arctic down to the U.S. Plains; but low pressure over western Alaska.


It's ironic that the cold air of the so-called "polar vortex" is actually associated with high pressure at the surface, not the low pressure of a cyclonic circulation.  But the term is a misnomer in its popular usage: the "polar vortex" more properly refers to the wintertime circulation in the stratosphere, 10-30 miles above the surface.  Read more about this at NOAA's new polar vortex blog:

https://www.climate.gov/news-features/blogs/polar-vortex/welcome-polar-vortex-blog

Getting back to near-Alaska conditions, the cold in northwestern Canada has been harsh in recent days: into the -50s Fahrenheit in many locations.  But despite several days in the -40s at Dawson, the Yukon River still isn't properly frozen over: here's the latest webcam image from noon today.

This is a repeat of the no-freeze-up difficulty of several recent years, with no ice road crossing between West Dawson and the main town.  There's a trail crossing upstream:

https://ca.news.yahoo.com/dawson-city-residents-trying-build-090000069.html

The webcam animation from Thursday shows lots of steam in the cold weather, but apparently no real action in terms of ice formation.


Thursday, January 11, 2024

December Climate Data

Looking back at December, the dominant circulation feature near Alaska was a pronounced Bering Sea trough, with 500mb heights significantly below normal over western Alaska.  And so it was another wet month for the state - the 8th wettest December on record (1925-present), according to NOAA/NCEI data.  By my count, every month in 2023 except October was wetter than the long-term median for Alaska as a whole, and it was the wettest year statewide since... last year.


December's mid-atmosphere flow pattern was quite reminiscent of a typical El Niño outcome.  The map below shows the average 500mb height anomaly for 10 Decembers with strong El Niño conditions.


Interestingly, this occurred despite dramatically different North Pacific SST patterns - compare the two maps below.  This highlights the fact that it's tropical SSTs (and associated tropical convection) that tend to drive higher latitude circulation anomalies.  Extratropical SSTs have an important influence in terms of setting a baseline for air temperatures locally and downstream, and they can reinforce prevailing weather patterns (e.g. a trough over locally colder ocean regions), but they can't compete with the likes of a strong El Niño in terms of overall circulation forcing.


Having noted El Niño's large-scale signature in the December circulation pattern, however, there were subtle differences.  The Bering Sea trough was a bit farther north than usual, and that created less warm southerly flow and more cold westerly flow into western and southern Alaska.  Compare the air temperature maps below; the southwestern quadrant of Alaska was colder than would be typical of El Niño.


Here are my usual climate rank maps based on ERA5 and NOAA data:


The Panhandle was exceptionally warm, with only a handful of Decembers being warmer in the modern climate history.  The Southeast warmth was merely the western margin of a vast area of extreme warmth across Canada - the warmest December on record in many places.  Canada is used to relatively warm winters during El Niño, but this was off the charts.

Here's the estimated distribution of precipitation anomalies: much wetter than normal in the Southeast and eastern interior, and either wet or dry elsewhere depending on which data source you prefer.  Given the abysmal state of ground-truth precipitation measurements these days in Alaska, the ERA5 model data is probably preferable. 


Wind was below normal for a large part of the state, which is a bit surprising given the proximity of the trough; but it was evidently a rather stagnant pattern, with the storm track and higher winds taking aim at the Panhandle rather than running up into western Alaska.


As for the Arctic, warmth was extreme on the Canadian side.  For 3 of the sites noted below - Resolute, Cambridge Bay, and Kugluktuk - it was the warmest December on record, and these all have more than 50 years of data.  At Cambridge Bay, with 87 years of data, the previous December record was broken by more than 2°C (-20.1°C vs -22.2°C in 1987).


And as for Utqiaġvik, it was the 3rd warmest December on record, behind only 2017 and 2022.

For more details, Rick Thoman's December summary is well worth a read:


Tuesday, January 9, 2024

Follow-Up

A quick follow-up post on last week's big pressure gradient and associated wind: with ERA5 data now available, the peak MSLP difference between two Alaska land points was 95mb, i.e. not an all-time record, but certainly in the upper tier of these events.

However, I redid the historical calculation for land points from 170°W eastward, i.e. excluding the central and western Aleutians.  The rationale is that last week's Aleutian cyclone was farther east than others that produced extreme pressure differences across the state, and I wanted to see if it might be an all-time record for the more restricted domain.


And the answer is - yes!  The pressure difference of 95mb within Alaska east of 170°W is indeed the greatest back to 1950, based on hourly ERA5 data.  Only two previous events exceeded 92mb across this domain: November 26, 1985, and December 5, 2009.


Here's a revised chart of the annual (cold season) maxima for the smaller domain:


Interestingly there seems to be a slight downward trend in the series, although it's not statistically significant.  Another interesting aspect is the tendency for large positive outliers once every 10-20 years.  Last week's set-up was a rare event.

Most regrettably, the high winds produced by this system led to treacherous conditions high on the Steese Highway last Wednesday, leading to the deaths of two motorists:

https://www.adn.com/alaska-news/2024/01/05/recovery-of-2-found-dead-in-interior-alaska-vehicle-complicated-by-poor-weather-troopers-say/

Conditions were indeed very poor: here's the hourly data from the Eagle Summit SNOTEL site (click to enlarge).  Columns are temperature and wind chill in °F, wind direction, wind speed in mph, and solar radiation (absolute and percent of possible).


I don't have historical data for comparison, and Eagle Summit is notoriously cold and windy, but it's clearly not the kind of weather you want to encounter unprepared.