Thursday, December 30, 2021

How Cold Will It Get?

Given the magnitude of recent extremes in Alaska, it only makes sense that the upcoming cold will also be quite extreme.  The dramatic change will occur as the big North Pacific ridge builds north over the Bering Sea and into the Arctic, so that much of Alaska will soon find itself on the opposite side as far as temperatures are concerned.  Here's the 500mb height forecast for Monday morning, with color shading indicating the departure from normal.


By late Saturday, a very cold air mass will be centered over the southeastern interior, with predicted 850mb temperatures below -35°C.  That's seriously cold.


An 850mb temperature of -35°C hasn't been observed in Fairbanks since 1999, although late January 2012 came very close.  However, it looks like the core of the cold will miss Fairbanks, so -30°C or so seems more likely on the Fairbanks sounding.

Cold at valley-level will be severe, but just how bad will depend on winds and cloud cover, as usual.  Widespread -40s seem likely, and given the location of the cold core I wouldn't be at all surprised to see -60°F at Chicken.  The last -65°F at Chicken was in 2009.

Speaking of cold, it's worth noting that southeastern Alaska has already been experiencing the cold side of the flow pattern in recent weeks, even while extraordinary warmth has occurred elsewhere in the state.  Ketchikan dropped to 0°F and saw two back-to-back days with high temperatures below 20°F; both of these feats were last achieved in 2012. 


Wednesday, December 29, 2021

More Wild Weather

Another day, another climate headline: 2021 is now the wettest year on record in Fairbanks.  Rick Thoman illustrates the remarkable increase since 2013:


A leading hypothesis for explaining the change has to be the sustained tendency for North Pacific high pressure, which is linked to unusual sea surface warmth (recall the so-called "blob" of warmth dating back to winter 2013-2014).  As discussed in recent days, an intense North Pacific ridge is to blame for the current onslaught of wild weather; here's a nice animation courtesy of Stu Ostro at the Weather Channel:


Last night's winter storm in Fairbanks ended with a remarkable and extremely unusual snow squall this morning: heavy snow, near-zero visibility, and winds gusting to 45 mph.


For posterity, here's the airport METAR at the height of the squall:

PAFA 291653Z 28024G39KT 1/4SM R02L/1200V2600FT +SN BLSN FG VV004 M01/M03 A2956 RMK AO2 PK WND 28039/1645 SLP020 P0003 T10061033 $

Heavy wind-driven snow like this is virtually unheard-of in Fairbanks, and I found only a tiny number of past cases when conditions may have been similar.  In fact there are zero previous observations with a combination of moderate or heavy snow, visibility of 1/4 mile or less, and sustained winds of 20 knots or greater; but Rick pointed out that in earlier decades the observer may have just reported "blowing snow".  Even then, the only dates that may have been similar are the following:

March 28, 1948

Dec 28, 1951

March 10, 1963

Feb 26, 2011

Here's one of Rick's comments in the aftermath of the 2011 event: "February 2011 will be long remembered in the annals of Fairbanks weather lore, with back to back storms that are close to "blizzards" as Fairbanks ever gets (which is to say, not that close)."

https://ak-wx.blogspot.com/2011/03/february.html


Tuesday, December 28, 2021

Storm Follow-Up

As if to add insult to injury, freezing drizzle is being reported around the Fairbanks area today, following a modest snowfall earlier in the day.  A vertical profile from this morning's GFS model run, valid at 9am, shows a cloud-top temperature of about -14°C, which is a bit colder than you would expect for freezing drizzle, but presumably in reality the cloud top is a bit lower and warmer than that.  See here for an old post on freezing drizzle.


A big portion of the interior is under a Winter Storm Warning again, and the latest available GEFS forecast shows the potential for an inch or more of additional liquid-equivalent precipitation in total with this latest event.
Then it will get cold.  The lowest 850mb temperature in Fairbanks back in November was -28°C, and it appears that this weekend may rival that.  There's certainly the potential for -40° again at valley level.

Meanwhile, extremely warm - and in some places absurdly warm - conditions are persisting in southwestern Alaska, as the powerful North Pacific ridge continues to pump warm air up from the south.  This is the 12th consecutive day that Bethel has seen 32°F or higher, which seems like a prolonged warm spell, but the record is 26 consecutive days in - no surprise - January 1937.

The turn-around from the November cold is really striking:


I can't fail to mention also the ridiculous warm record that was broken in Kodiak on Sunday: 65°F at the airport (the official climate site) and 67°F at the harbor tide gauge.  This is a new record for the entire state of Alaska in the month of December.  Astonishingly, a temperature of 65°F or higher has not previously been seen in Kodiak between early October and late April, i.e. more than 6 months of the year.  On that basis, it would be the equivalent of Fairbanks reaching nearly 70°F at this time of year. (Note that there is Kodiak data from January 1937, but the best Kodiak could do then was 50°F).  

What could explain such a dramatic shift from the cold of November to the extreme warmth this month?  Obviously it's tied to the position of the North Pacific ridge, but why did it shift east?

To illustrate the shift, here's a time-longitude diagram showing the recent and forecast evolution of 500mb heights in the 45-75°N latitude band.  During November we can see yellow/orange colors (ridging) to the west of Alaska and a preponderance of blue (troughing) at the longitude of Alaska, and this was the pattern that produced the cold.  However, beginning about 10 days ago, a very powerful ridge emerged to the east of the Date Line, and it has been holding steady with remarkable persistence (and may generally continue to do so, if this forecast is correct).


Now here's what I think forced the transition to a more easterly ridge: an eastward shift in tropical convection (thunderstorm activity) in early December.  The graphic below shows areas of enhanced convection along the equator in blue and suppressed convection in yellow, and in the first half of November we see that convection was focused from the eastern Indian Ocean to Indonesia.  However, at the beginning of December the convection migrated into the western Pacific Ocean, and this represents a breakdown in the typical La Niña pattern over the equatorial ocean.  As I discussed in this post, the typical cold of a La Niña winter in Alaska is linked to the position of the convective activity, and so it makes sense that the North Pacific pattern would shift in the weeks following the tropical change.  This also means that if the La Niña forcing doesn't re-emerge, then sustained cold may be less likely in the rest of winter.


For the technically inclined, the eastward shift in tropical convection was brought about by a strong eastward-propagating pulse of the Madden-Julian Oscillation (MJO); see here for an introduction to the MJO.  The phase diagram below demonstrates the change of phase from November (green) to December (blue), with the key transition occurring around December 1, as noted above.  If the MJO activity eventually makes it back to the lower part of the diagram, then it may again reinforce La Niña-like patterns over the North Pacific, but this appears unlikely to happen before late January.


Monday, December 27, 2021

Power Outages

Big problems loom for Fairbanks-area homes and businesses that continue without power into tonight, as temperatures drop off to levels that will produce damage in unheated structures.  As of 1pm, GVEA is reporting more than 6000 customers without electricity; hopefully many of these have robust supplemental heat sources for just such on occasion as this.


Temperatures are down to around 20°F as the winds have died down under partly clear skies, and the NWS is going for a low temperature of 10°F tonight.  The next round of cloud and snow will prevent a bigger drop for now - the real cold comes later in the week.


As reader Gary noted, above-freezing temperatures beginning yesterday afternoon did help prevent even greater damage to infrastructure, as accumulated snow and ice was melting quickly by the time winds picked up in the evening.  Wind without a thaw would have been even worse.

Last night's high temperature of 41°F was the first 40+ temperature in winter for over 4 years in Fairbanks, but this was no chinook flow from the south; the wind was more or less westerly through the entire depth of the troposphere:


Historic Winter Rain

In the recorded history of Alaska climate, January 1937 has often stood out to me as an amazing extreme of winter precipitation in Fairbanks.  In that month, 6.7" of liquid-equivalent precipitation fell, making it by far the wettest winter month on record, and one of the wettest calendar months for any time of year.  An onslaught of both rain and snow occurred in two waves that month, with the second round dropping 3.2" of precipitation in 3 days.

Prior to the events of the last two days, the January 1937 outcome was almost unimaginable, but remarkably after 85 years we have now seen something of a similar order of magnitude.  There will be much to write about, but for now the 48-hour precipitation totals speak for themselves - see below, and click to enlarge.  If only one or two sites had reported totals like this, they would have been dismissed out of hand, with an assumption of instrument malfunction; but it seems to me that the consistency between ASOS and SNOTEL tipping buckets as well as the high-quality CRN weighing gauge (3.10" in the bottom image below) provide a strong case for the extraordinarily large amounts being real.

More blog posts to come, and I invite readers to comment with any and all personal observations, measurements, or experiences from the storm.


Saturday, December 25, 2021

Big Interior Storm

[Update 6:30pm Saturday]  The latest NWS forecast graphic is ugly, to say the least.  Best wishes to all in the path of this potentially historic ice storm.


[Original post 7am Saturday]

With a major snow and ice storm bearing down on the interior this Christmas Day, it's interesting to note the similarity in the mid-atmosphere flow pattern between tomorrow (forecasted) and the 1970 pre-Christmas onslaught of precipitation in Fairbanks - see below.  Other than January 1937, the week leading up to Christmas 1970 was the wettest winter week on record in Fairbanks, with over 2" of liquid equivalent, and nearly a quarter-inch of rain.  Let's hope the rain stays away this time, but I fear the worst.

Season's greetings to all!


Thursday, December 23, 2021

Monday's Warmth

This is just a quick follow-up to note the rare and remarkable character of Monday's widespread warmth over western, central, and northern Alaska.  With a strong low pressure system over far eastern Russia and a powerful Pacific ridge to the south, strong southwesterly flow swept over western parts of the state, and temperatures rose above freezing across vast areas.

Here are the high temperatures observed that day; click to enlarge (apologies for the split image).

North:

South:

It's remarkable to see that the temperature reached 32°F or higher at valley level nearly everywhere to the west and north of the Alaska Range, except in the eastern interior and the Brooks Range.

I looked at the history of the following 8 observing sites for dates when 32°F was reached at all of the locations, and this is the first time on record for December.  Here are Monday's high temperatures at the 8 sites, which all have data back to at least the early 1950s.

King Salmon  37°F
Bethel  34°F
McGrath  37°F
Fairbanks  33°F
Bettles  34°F
Nome  34°F
Kotzebue  33°F
Utqiaġvik  32°F

There have been a few early November dates when all 8 sites reached 32°F (including last year), but the only other date in deep winter that achieved this feat was February 4, 1982; it has not been observed before in December or January.  However, if we take out Utqiaġvik, then it's not as uncommon, particularly in recent years: 2015, 2016, and 2017 all saw similar widespread warmth in December, but not extending all the way to the Arctic Ocean.

And a quick note on current weather: the thaw has lasted about a week now in the Bristol Bay region, which is an astonishing turnaround from November's extreme cold.  This morning the warmth is spreading inland again, and it's raining and +34°F at Aniak.  Contrast that with -34°F at Fort Yukon.


Monday, December 20, 2021

Wiseman Snow Follow-Up

Last week's post mentioned the remarkable 41" snowfall at Wiseman a couple of weeks ago, and I remarked that the limited historical data suggest this location is prone to occasional very large snow events.  Here's some follow-up based on a slightly closer look.

First, it's interesting to note that the average seasonal snowfall totals are not particularly high at Wiseman.  Based on a common set of 13 winters since 1996 that have reasonably complete data at Wiseman, Bettles, and Fairbanks, the median seasonal snow totals indicate that Bettles is considerably snowier overall:

Bettles   97"

Wiseman   72"

Fairbanks   57"

Despite this, Wiseman reported daily snow amounts of 12" or more on 10 different days during these winters, whereas Bettles had only one such day, and Fairbanks had none!  (But a few days came close in both Bettles and Fairbanks.)

Here's a simple chart showing the frequency of days with snow totals in several categories, again based on a common set of 13 winters.


One possible explanation for the large excess of big snows at Wiseman would be that the observer(s) may have tended to report storm totals as single-day snow amounts on the final day of a multi-day event.  However, some of the big single-day totals also have large snow amounts on adjacent days, leading to extreme storm totals, such as:

40.5"   Jan 23-24, 1999 (the two-day record until the most recent event)

47.5"   Jan 22-24, 2000

29.6"   Feb 12-13, 2019

Given what happened two weeks ago, with independent corroboration from the Coldfoot road crew, there's no doubt these events can happen.  It's just surprising that they don't show up in terms of high seasonal averages; but perhaps that could be explained by the observer failing to report many small events that would add up significantly over the course of a long winter.

For reference, here's the location of Wiseman; it certainly makes sense that orographic lifting would squeeze a lot of moisture out of flow that comes up from the southwest.


By way of comparison, the SNOTEL sites at Bettles and Coldfoot show similar snowpack statistics, with median water-equivalent snowpack peaking between 6" and 7" in late winter.  It's a little difficult to imagine that Wiseman would be much different, only 10 miles north of Coldfoot.


Speaking of heavy winter precipitation, Fairbanks just saw over an inch of liquid-equivalent in 24 hours, as another round of extremely warm and moist air enveloped a large part of the state.  I'll hopefully be able to post more comments on this soon.


Saturday, December 11, 2021

Weather Notes and November Data

It's been an active week for Alaska weather in the wake of the big warm-up, with a fast-moving storm raking the lower Alaska Peninsula on Thursday, followed by cold air rushing back into the western part of the state as the ridge rebuilds over the Bering Sea.  Wind chills along the west coast today are some of the lowest so far this winter.

Cold Bay saw hurricane-force wind gusts on Thursday, and sustained winds exceeded 50 knots (57 mph); this only happens about once every other winter on average.


More significantly - from a statistical standpoint - was the remarkably intense snowfall that occurred earlier in the week on the southern foothills of the Brooks Range: the Wiseman co-operative observer reported over 41" of snow in two days.  This is an all-time record for two-day snowfall in the Wiseman period of record, which includes about 30 winters of reasonably complete snowfall data.

The previous two-day record was 40.5" in January 1999, but 30" has been exceeded four times before this week - and February 2019 came very close (29.6").  For comparison, the all-time maximum two-day snowfall in other interior locations are as follows:

Bettles   25.0"

Fairbanks   26.9"

McGrath   21.0"

Amazingly, the Wiseman snow amounted to only 1.09" of liquid equivalent, so that's a 38:1 snow:liquid ratio.  Here's what it looked like on the nearby Dalton Highway:


The incredible snowfall appears to have been a consequence of the deep southerly flow that prevailed for some days to the east of the near-record Bering Sea storm.  Lots of moisture was transported up from the south, the Brooks Range topography created orographic lift, and evidently there must have been some west-east convergence to set up a near-stationary band of heavy snow.  One wonders how much fell on the higher terrain just to the north.

On another topic, below are the November NCEI and ERA5 rank maps to follow up on my earlier comments.  In addition to being extremely cold in the west and southwest, those areas were also generally much drier than normal, much less windy than normal, and much sunnier than normal (for what that's worth at this season).


Tuesday, December 7, 2021

How to Eliminate Cold

The reprieve won't last long, but a very powerful Bering Sea storm has dramatically swept away the cold air that dominated the state in the past few weeks.  It was an extraordinary transformation: check out the sequence of daily temperature maps below, showing Friday through yesterday.


Rick Thoman notes the extraordinarily rapid change in the statewide daily temperature index:


The storm was a nasty one along the Bering Sea coast, with very high winds.  Here are some of the peak gusts, courtesy of NWS:


The following article describes some of the impacts on coastal communities.  Rick notes that sea ice was sufficient to prevent serious coastal flooding, which illustrates a major upside of the recent cold weather.

http://www.thearcticsounder.com/article/2149wind_gusts_in_northwest_alaska_pushed_away

Here's the NWS sea ice analysis from Friday.

Below are the 500mb and surface analysis maps from 3 am yesterday morning (December 6), courtesy of Environment Canada.  MSLP of 958 mb was reported on Sunday afternoon on St. Lawrence Island (at both Gambell and Savoonga), and that appears to be close to the all-time record for the area (about 955 mb according to 1950-present ERA5 data).


This powerful storm may come as a bit of a surprise in a strong La Niña, because just a few weeks ago I discussed the fact that the Aleutian Low tends to be weaker during La Niña.  However, another very interesting aspect of La Niña winters is that daily variability tends to be higher, so the weather patterns near Alaska tend to be more volatile.  I explored this topic a few times in past years, so search for "ENSO variance" if you're interested; or check out the following post.


Thursday, December 2, 2021

Cold November in the Books

What a month November was, with amazingly persistent cold over western and southwestern areas after the first week of the month.  As expected, it was easily the coldest November on record at King Salmon.


Rick Thoman's November temperature map (below) shows the depth of the cold anomalies - over 20°F below the 1991-2020 normal in spots - but also illustrates that not all of the state was affected: it was warmer than normal in some locations!


Given that cold was not universal, it's remarkable to see that UAF's statewide temperature index stayed below -8.0 for 17 consecutive days (see below).  A value of -8.0 corresponds to the 10th percentile of the 1991-2020 distribution for the time of year, so the state as a whole was colder than the 10th percentile for 17 straight days.  Read more on the UAF index here.  Interestingly the index reveals that the cold back in September - although much less dramatic in absolute terms - was comparable in statistical significance on the days when it occurred, although it didn't last all that long.


Cold continues today, with another -28°F at King Salmon (only two other years have ever been this cold so early in the winter), and -30°F at Unalakleet (and they saw -33°F on Sunday morning).

Also, it's worth noting Alaska's first -50°F of the winter at Toolik Lake on Tuesday morning.

Sunday, November 28, 2021

La Niña Follow-Up

As very unusual cold persists in western and south-central Alaska this weekend, it's worth revisiting a statement I made in last Saturday's post about the typical impacts of La Niña on Alaska winters.  I suggested that Alaska gets more cold out of La Niña than might be expected from temperatures aloft (well above the surface), because of a propensity for clear skies and calm winds that facilitate surface cooling.

After taking a quick look at some data, I'm no longer as confident about this, although more could be done to examine the hypothesis.  Consider the chart below, showing the relationship of Fairbanks surface (2m) temperature to 1000-500mb thickness in December through February.  (1000-500mb thickness is a good measure of the average temperature in the lowest half - by mass - of the atmosphere.)


The correlation between temperature and thickness is high, and it's clear that strong La Niña events tend to produce cold winters.  However, there is no compelling departure from the overall relationship during La Niña.  I was expecting to see surface temperatures lying mostly below the trend-line for La Niña winters, which would have indicated that the surface is systematically colder than temperatures aloft would normally dictate.  But in fact it looks like surface temperatures are generally in line with upper-air temperatures; La Niña winters are - on average - equally cold aloft and at the surface in Fairbanks.

On the other hand, there is a slight hint that the strongest El Niño winters are a bit warmer at the surface than would be expected, with only 3 of 10 strong El Niño winters lying below the trend-line, and 6 of 10 above.

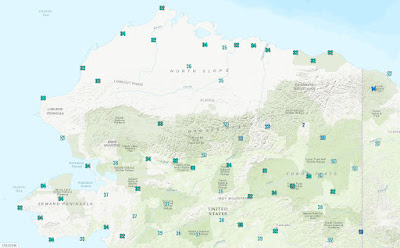
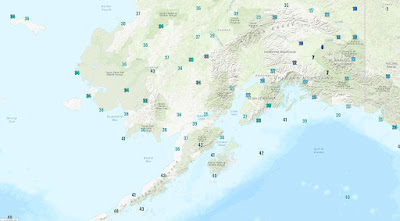
In an ideal world, the next step would be to look at wind speed and cloud cover data from Fairbanks, but the long-term historical record is not really suitable for this kind of analysis over many decades, because instrumentation and measuring practices have changed.  Gridded reanalysis data is probably a better bet, and ERA5 does show an indication that strong La Niña winters are often less windy than strong El Niño winters across the central and northern interior - see below (La Niña top, El Niño bottom).  But it's a rather weak signal that reverses sign for south-central Alaska, and Fairbanks is close to the transition zone.


As for cloud cover, I only looked at ERA5 solar radiation, and of course the big caveat here is that the December-February signal is largely dominated by February.  With that said, it looks like clear skies are indeed slightly favored near Fairbanks in strong La Niña winters, but again the signal is weak.  ERA5 does have a cloud cover variable, but I haven't obtained that data yet.


So in summary, my hypothesis about cold being focused at the surface during La Niña winters can be put on hold, although I'd like to dig in a bit more before dropping it completely.

As an aside, the charts below show the 70-year history of Dec-Feb surface temperatures and 1000-mb thickness, with the strong ENSO years indicated.  The ENSO state is actually more strongly correlated, in a linear sense, with thickness than with surface temperature, and the charts confirm this: there's almost no overlap between the opposite ENSO states in terms of 1000-500mb thickness (when compared to trend), whereas several of the winters were near-trend in terms of 2m temperature.  In particular, strong La Niña apparently provides a high probability of notably below-trend thickness.