Saturday, December 31, 2022

Cloud Cover Climate

A few weeks ago, a reader asked if I could add some discussion and analysis about cloud cover in Alaska, and its relationship to high and low pressure systems.  I decided to look at this using ERA5 reanalysis data, because it's easily accessible and should have reasonably good quality, being constrained by satellite measurements.

The first thing to glance at is the climatological normal for cloud cover, at least according to the model.  Here's the ERA5 estimate of the annual mean percentage of sky that's covered by cloud at any height above ground (click to enlarge):


Not surprisingly, the cloudiest regions are the Aleutians and southwestern Alaska, Southeast Alaska, and the northern North Slope.  It also makes sense that the northern interior is the least cloudy part of the state, as it's relatively far removed from the storm-frequented Aleutian region and is also sheltered from Arctic storminess.  I'm not sure I would have guessed, though, that northwestern Alaska to the south of the Brooks Range has as little cloud as the much more continental zone in interior northeastern Alaska.

The seasonal breakdown is striking - see maps below for January, April, July, and October.  Much could be said on this, but I'll just note the relatively high proportion of clear skies across the interior in winter (good for aurora-gazing!); and obviously late winter and early spring have the clearest skies for most, being also the driest time of year for all of the state except the maritime south (where early summer is drier).  Also - summer is relatively (some would say dreadfully) cloudy for most of southern Alaska.


A wider view of the high-latitude Northern Hemisphere shows that interior Alaska has some of the clearest skies of any sub-Arctic location in January.  With long hours of darkness, this makes Fairbanks a top international destination for aurora seekers.  In contrast, notice how very cloudy western (and indeed most of) Russia is.


For completeness, here are the other months, and the annual average, for the high-latitude hemisphere.


Russia does much better than Alaska for sunshine in summer, and in fact it has a dramatically more pronounced seasonal cycle of cloudiness.  This is completely new to me, and I'll have to think about why this is.

I'll pick up this thread in another post, looking at the relationship between pressure patterns and cloud cover for different parts of Alaska.

Happy New Year to all!


Monday, December 26, 2022

Winter Rain

First, a quick comment to recommend Rick Thoman's detailed report on the unusual weather events of the last 7-10 days for many parts of Alaska:

https://alaskaclimate.substack.com/p/alaskas-wild-winter-solstice-week

The deep and sustained cold in the eastern interior has been a key feature recently, as illustrated by Chicken's five consecutive days with high temperatures of -50°F or below and low temperatures of -60°F or below.  Tok had its coldest five-day period since 2012.  But the cold wasn't confined to the interior: Kenai airport recorded a high temperature of -16°F on December 20, which is the coldest day there since the historic cold snap of January 1989.

Rick also documents the extremely high winds in disparate parts of southern Alaska, extreme rain in the Aleutians, and an absence of sea ice in the northern Bering Sea.

Turning to another topic, earlier this month I noted the record warmth and widespread rain in western and Arctic Alaska.  I subsequently spent a bit of time examining observations from most of the ASOS/AWOS sites in northwestern Alaska and along the Arctic coast, and indeed nearly all of them reported rain at some point between December 2 and December 5.  Utqiaġvik did not get above freezing while it was raining, but I counted 24 other sites that saw plain rain, i.e. rain with temperatures above freezing.  Remarkably, rain was observed even as far east as Barter Island, including a period of 8 consecutive hours of plain rain.

In the past couple of weeks I've been processing ERA5 reanalysis data in an effort to put this event in context and understand the historical trends and variability in winter rain for Alaska and more widely in the Arctic.  The usual caveats apply to the results - the ERA5 data is only an estimate of true conditions on the ground - and frankly I don't know the accuracy/quality of the precipitation type estimates; but it may be possible to say something about the quality in due course.

For now, I'll show a few preliminary results on the historical ERA5 trends, and then in a subsequent post I'll see what ERA5 has to say about the recent event.

First, here's an Arctic-wide map showing the normal (mean) number of hours with rain or freezing rain in November through March for the 30 winters from 1991/92 to 2020/21.  I'm only showing data for areas where the 1991-2020 normal temperature is continuously below -5°C from November 1 through March 31, so we're looking only at cold regions where winter rain would tend to cause significant problems (i.e. rain falling on snowpack and/or deeply frozen ground).


There's a notable climatological maximum of winter rain in southwestern Alaska, and extending northward across the Seward Peninsula and east to the middle Tanana River valley.  Qualitatively this seems correct; Bering Sea storms quite frequently import warm air aloft and/or at the surface to the west and north of the Alaska Range.

Here's the corresponding map for earlier decades: 1950/51 through 1990/91.  The patterns are very similar, but the values are somewhat lower in the earlier years for the Seward Peninsula and northwestern Alaska.


Here are maps showing the change between the two periods, both in absolute (top) and relative/percentage (bottom) terms.


This confirms a fairly widespread increase in hours with winter rain for southwestern and western Alaska, as well as in the parts of Russia where freezing rain is climatologically possible.  On the other hand, however, ERA5 suggests there has been some decrease in frequency for some parts of interior eastern Alaska.

The changes appear to have been concentrated more in the past decade than in (say) 1990-2010.  Here are the corresponding maps comparing 2012-2021 with the earliest 40-year period.


We now see widespread increases across most of Alaska north of 60°N - according to the ERA5 model.

For a sense of the annual variability compared to the trend, I extracted the area-average number of hours of rain for each winter across Alaska's land area north of 60°N (again excluding warmer areas):


The large year-to-year variability means that the trend may not be highly significant - I haven't attempted a statistical test  - but there have been generally elevated values since 2013/14.  Interestingly, though, the period from 1979/80 to 1986/87 also seems to have produced relatively more frequent/widespread winter rain.

For the Arctic as a whole (using 60-90°N land area), the reduced interannual variance allows the trend to stand out a bit more clearly; we see a notably sustained high frequency of rain since winter 2013/14.


As soon as I have a chance, I'll look at this winter so far in the ERA5 data and see whether the model faithfully reproduced the early December event.

Monday, December 19, 2022

Serious Cold

Last week I mentioned the big contrast in temperatures that always accompanies a major upper-level ridge, with warm southerly flow drawn up on the west side of the ridge axis, but cold northerly flow on the east side (in the northern hemisphere).  La Niña tends to bring the cold side of the equation to much of Alaska, and that's exactly what we're seeing now, with - in this case - a really huge ridge ballooning north through the Bering Strait in the past couple of days.

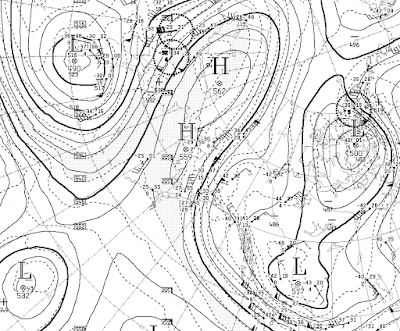
Here's the mid-atmosphere 500mb height analysis as of 3am this morning, courtesy of Environment Canada:


A 500mb height of 5620m at 72°N is extreme for the time of year, and it's going even higher in the next few days, perhaps breaking the 1950-present record for the winter months over the East Siberian Sea.  The regional record to beat was set in January 2011 - see Rick Thoman's comments in several posts from the time.  (There's that 2010-2011 analog showing up again: strong La Niña, with very strong Arctic ridging/blocking that brought severe cold to the mid-latitudes, just as we're seeing this winter.)

Under clear skies and calm winds, the Arctic air mass has allowed temperatures to plummet in the eastern interior.  Here are today's minimum temperatures in degrees Fahrenheit as of about 7pm (click to enlarge):


In the Fairbanks area, the North Pole 1N co-op station reported -50°F.  Of course Chicken was the Alaskan cold spot: -57°F this morning, and a daily maximum of -50°F for yesterday.  A daily high of -50°F is about normal for the coldest day of the winter in Chicken, but it nearly always happens in January; this is in fact the earliest in the winter that a daily high of -50°F has been observed in Chicken (data since winter 1996-97).


Thursday, December 15, 2022

November Climate Data

The month of November was relatively warm for Alaska as a whole, but there was significant variation across the state: it was very warm in the north and in the western Aleutians, but unusually cold in Southeast Alaska.  Utqiaġvik was more than 8°F above the 1991-2020 normal (over 13°F above the 1981-2010 normal), whereas far away to the southeast, the South Panhandle climate division saw its 5th coldest November on record.

The cause of the big temperature contrast was an unusual ridge axis that prevailed over southwestern Alaska; this pumped extremely warm air up into Arctic Alaska at times, but cold northerly flow was sustained on the east side of the ridge.


The unusual ridge was not far removed from a typical La Niña setup for the time of year, although the classical La Niña ridge tends to be anchored a bit farther west over the Bering Sea, producing more widespread cold across Alaska.

The available data suggest that November was considerably wetter than normal for western and especially Arctic Alaska, which is no surprise given the influx of southerly flow.  On the other hand, the Panhandle was somewhat sheltered by the ridge axis and was drier than normal.


The ERA5 dewpoint data nicely illustrates the excess moisture associated with the warm air masses across the Aleutians and northern Alaska.


As for wind, it was apparently very calm compared to normal in the northern interior.

I checked the wind data from recent years at the Livengood RAWS, and indeed this November was the calmest in at least 10 years (see below for average monthly wind speed in mph).  It's nice to see the ERA5 reanalysis estimate confirmed by a bit of ground-truth data.

Nov 2022  3.2

Nov 2021  6.8

Nov 2020  4.6

Nov 2019  7.7

Nov 2018  7.3

Nov 2017  3.3

Nov 2016  6.6

Nov 2015  3.3

Nov 2014  7.3

Nov 2013  3.7

Nov 2012  8.7

Farther afield in the Arctic, the warmth in the north extended east into the Canadian Arctic, but not as far as northeastern Canada, where it was a very cold month.  At 80°N, Eureka had its coldest November since 1993.  Eastern Siberia was also considerably colder than normal, but the Atlantic sector east of Greenland was very warm: it was a month of extremes around the Arctic.

The most extreme anomalies were on the warm side, as we might expect, with Jan Mayen having its warmest November on record, and Inuvik and Bjørnøya (south of Svalbard) having their 2nd warmest.  Barentsburg on Svalbard was 3rd warmest on record.

Here's the November temperature map with anomalies expressed in terms of standard deviations:


Tuesday, December 13, 2022

Anchorage Snow

Rick Thoman has a Substack post up about the snow onslaught in the Anchorage area: there have been two big storms in a week, producing nearly 30" of snow at the airport, and more in some spots.  Rick shows that the 7-day snow total is about a once-in-20-year event.

https://alaskaclimate.substack.com/p/anchorage-snowpocalypse-2022-edition

Seasonal snowfall totals in Anchorage have a modest (inverse) correlation with the Pacific Decadal Oscillation (PDO), a well-known pattern of sea surface temperature variations in the North Pacific.  Here's a scatter plot using data since 1953:


If we look at a map of sea temperature anomalies in the top 8 snowfall seasons, we see the negative PDO pattern, consisting of a horseshoe-shaped area of cool (for the negative phase) along the west coast of North America, along with unusual warmth in the central North Pacific.


The correlation between Anchorage snowfall and the PDO index has actually strengthened somewhat over time, with recent decades seeing extremes of both positive PDO/low snow (e.g. 2014-2016) and negative PDO/high snow (e.g. 2011/12).


The PDO has been negative for more than 2 years now, so last winter's relatively high snowfall and the current "snowpocalypse" fit the historical pattern nicely.


Tuesday, December 6, 2022

Utqiaġvik Record Warmth

Following hard on the heels of the remarkable episode two weeks ago, the last few days have again seen extremely unusual warmth surge northward across western Alaska and the North Slope.  Freezing rain and even plain (above-freezing) rain was observed widely, leading to loss of snow cover and significant ice accretion in places.


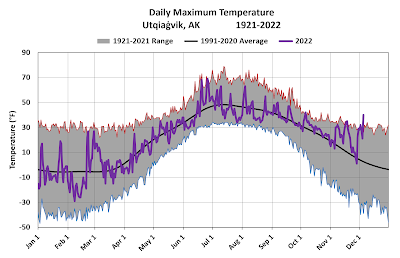
From the perspective of the long-term climate record, most remarkable of all was Utqiaġvik's 40°F yesterday morning on strong southerly winds.  This temperature was measured by both the airport ASOS and the CRN site outside town, and it's the highest temperature ever recorded in winter in Utqiaġvik.  Continuous climate observations have been made there since 1921.  Here's a graphic (click to enlarge):


There will be more to say about the rain and freezing rain when I've had a chance to look through the observations more carefully.  For now, it suffices to say that rain has occurred at most or all of the automated sites across northwestern Alaska and North Slope, and even as far east as Toolik.


The excessive high-latitude warmth hasn't been confined to Alaska: it's been raining in Greenland too.


Here's part of the reason why: the Arctic Oscillation has turned sharply negative, which means that MSLP is above-normal in the Arctic, leading to cold in the mid-latitudes and warmth up north.  But of course that doesn't explain the new all-time temperature record; for that, we might suspect that the cause lies in the widespread unusual warmth of the North Pacific.  I suggested as much back in October: "The very warm ocean (relative to normal) ... will certainly boost warmth for Alaska whenever the flow comes from the southwest this winter." 


Thursday, December 1, 2022

New Alaska Climate Newsletter

Some readers will already be aware, but for those who aren't: Rick Thoman has started a Substack newsletter/blog focused on Alaska and Arctic climate:

https://alaskaclimate.substack.com/

There's a lot to talk about these days in Arctic weather and climate, and Rick (who started the Deep Cold blog) is a preeminent expert, so be sure to sign up for the subscription feature.

Thermometers have registered a sharp drop in the past few days for much of Alaska, with the first -40° showing up on Monday evening at Arctic Village.  The temperature subsequently dropped to -45°F, but the cold snap didn't last long.

Chicken also saw -40° this week, which is right on schedule for the time of year.  In the Fairbanks area, UAF's Smith Lake site reached -30°F.

On the other side of the pendulum, the North Slope has been extremely warm again, with Utqiavik reaching +29°F yesterday - very close to record warmth for the time of year.

The briefly sharp cold spell for interior areas has finally brought freeze-up to Dawson over in the Yukon Territory, judging from the webcam.  Here's a video showing today's scene, courtesy of http://dawson.meteomac.com/


The Tanana River at Nenana appears to still have open water, but not much: