Monday, September 26, 2022

More on 1992 Cold

Returning to the topic of the September 1992 cold snap, which was still ongoing 30 years ago... at this point in the month (the 26th) there was about a week left of the deeply unusual and persistent cold.  The worst of the cold, for the time of year, occurred around the 23rd and 24th, when Fairbanks saw two nights below 10°F; but this paled in comparison to -5°F in Nenana on the morning of the 24th, and a shocking -17°F at a RAWS site on the Yukon River near Beaver (the New Lake RAWS, no longer operating).

Rick Thoman has showed on more than one occasion that September 1992 was easily the most anomalous month for temperature in Alaska's climate history when the typical variability of the time of year is considered.  In other words, the standardized departure from normal is greatest for that month.  Here's a chart to illustrate for Fairbanks; click to enlarge.


Here I've defined a "contemporary normal" as the average monthly temperature within +/- 15 years of each year; this removes the long-term trend and makes for a relatively consistent analysis over time.  At the beginning and end of the series I just used the 30 years at either end, so for example the normal for 1930 is 1930-1960, for 1965 it's 1950-1980, and for 2022 it's 1992-2022.  Also, I excluded the year itself from its normal, so that the mean and standard deviation are not influenced by the year in question.

The big negative outlier is obviously September 1992, and interestingly May 1992 can be seen right next to it: May was a very anomalous month in its own right.  The delayed start to summer in 1992 compounded the damage from the early, heavy snow of September, because trees were still in leaf when the snow arrived.

It is interesting to observe the negative skewness in the distribution of monthly temperatures: five calendar months were more than 3 SD below normal, but only three months were at least 3 SD above normal.

While these calendar month statistics are interesting, it's worth asking whether September 1992 is also the greatest outlier on a running 30-day basis.  One can easily imagine a multi-week cold or warm spell that spans two months and doesn't show up as particularly unusual for either calendar month.  To address this, I simply repeated the exercise for all 30-day periods, with the contemporary normal defined for each day of the year.

The answer is that yes, the autumn 1992 cold was easily the most unusual 30-day temperature anomaly, with an astounding -5.3 SD anomaly for the 30 days ending October 7.

Only one other 30-day anomaly reached +/- 4 SD, and that was the 30-day period ending May 7, 2013.  Read about that cold spell in the blog archives, e.g. here.  April 2013 was itself the second most unusual calendar month.  Remarkably, June 2013 was then one of the most unusual months on the warm side, and the 30 days ending June 26, 2013 was the warmest 30-day period on record (+3.6 SD).  The turn-around in the last third of May was astonishing:

http://ak-wx.blogspot.com/2013/06/oh-what-may-it-was.html

Here are the ranked lists of greatest 30-day temperature anomalies on both sides: the dates are the ending dates of the 30-day periods.

-5.3 SD  October 7, 1992

-4.3 SD  May 7, 2013

-3.9 SD  July 8, 1949

-3.9 SD  August 21, 1969

-3.8 SD  May 24, 1992

-3.6 SD  May 30, 1964  (record latest breakup at Nenana, tied with 2013)

-3.6 SD  March 19, 2007


+3.6 SD  June 26, 2013

+3.6 SD  April 25, 1940

+3.4 SD  June 28, 2004

+3.4 SD  September 25, 1974

+3.3 SD  January 25, 1937

It would be worth writing a post on each one of these events, as I'm not familiar with them all.  It's interesting, though, that only one occurred in winter: it seems the natural variability of Fairbanks climate in winter is so large that the tails of the distribution are not as "heavy", i.e. very large standardized anomalies are less frequent.

Wednesday, September 21, 2022

Won't Be Long Now

The equinox is here, and that means winter is knocking at the door for interior and northern Alaska.  This morning there was freezing fog in Tanana, and the waning sun didn't lift the temperature above freezing until 1pm local time (11am solar time).  It was a lovely day after that (46°F currently), but the writing is on the wall.

Here's the transformation over the space of 30 minutes when the fog finally burned off in Tanana:


The scene will be turning wintry in the hills around Fairbanks tonight, according to the NWS:

319 PM AKDT Wed Sep 21 2022

...Snow Possible Tonight With Accumulation Above 1000 Feet...

A mix of rain and snow is expected across the Eastern Interior
tonight, including Fairbanks. Areas above 1000 foot elevation
could see 1 to 2 inches of snow accumulation. No snow
accumulation is expected in Fairbanks.

Motorists traveling the Steese, Richardson, Taylor and the Alaska
Highways should be prepared for winter driving conditions tonight
through Thursday morning.

This afternoon's sounding from Fairbanks shows the rather shallow layer of low-level air above freezing: it won't take much to get snow in this situation.


These colors at Cleary Summit on the Steese Highway (2234' elevation) are on the way out:


Monday, September 19, 2022

More On Ex-Merbok

Following up on the meteorology of the Bering Sea storm (formerly Typhoon Merbok), Rick Thoman penned some comments that are well worth reading:

https://theconversation.com/typhoon-merbok-fueled-by-unusually-warm-pacific-ocean-pounded-alaskas-vulnerable-coastal-communities-at-a-critical-time-190898

To Rick's point about unusually warm SSTs, the map below demonstrates that the storm did indeed pass over very unusually warm water in the northwestern Pacific as it was undergoing its transition from tropical to extratropical cyclone.  An SST anomaly of +4°C is extremely large, but it's been like this on and off since mid-summer in various parts of the northern and northwestern Pacific.


I don't think we can say with absolute certainty without doing modeling experiments, but I agree with Rick that the unusual warmth and moisture were very likely significant factors in the unseasonably extreme intensification of ex-Merbok as it moved into the Bering Sea.  As noted in yesterday's post, however, the mid-latitude jet features clearly also played an important role, with their strength and timing being "just right" to facilitate an extreme outcome.

In terms of impacts, flooding was the big story, and it was devastating for some communities.  This article documents many of the events in sad detail:

https://alaskapublic.org/2022/09/17/powerful-storm-slams-western-alaska/

Some of the most dramatic pictures were before and after shots from FAA webcams, such as these posted by NWS Fairbanks:


The news from Golovin at first light on Saturday was overwhelming:


A fact I saw frequently mentioned is that this was the worst storm in nearly 50 years, and that refers back to the benchmark November 1974 storm.  The late Ted Fathauer wrote about that event, but I don't have access to the article (perhaps someone can help):

https://www.tandfonline.com/doi/abs/10.1080/00431672.1975.9931740

More recently, November 2011 saw a tremendous Bering Sea storm, as mentioned on this blog at the time (beginning with the following post and several thereafter):

http://ak-wx.blogspot.com/2011/11/bering-sea-superstorm.html

As for this weekend's flooding, Rick Thoman showed that Nome's peak water level was higher than 2011 but not as bad as 1974:


Here are a couple of photos I grabbed from the Nome Visitor Center webcam on Saturday, showing an extremely threatening sea, and waves running up beside the building:


Let's hope many, many years pass before a storm like this returns to the long-suffering communities of western Alaska.


Sunday, September 18, 2022

Record Bering Sea Storm

The extreme Bering Sea storm of the past three days has now decayed to a weaker low pressure system near Point Lay, and west coast communities are beginning to clean up where they can.  Storm surge flooding was devastating in some villages and caused major damage in Nome.  Without question, this was one of the most intense and damaging storms in living memory for the coast from Hooper Bay up to Nome, and recovery will take a long time.

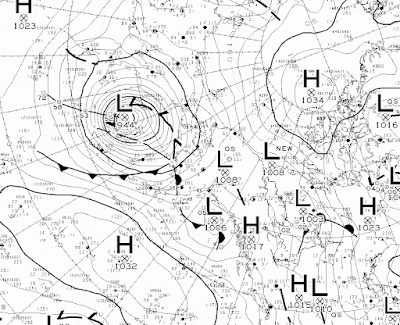
From a meteorological standpoint, the situation was remarkable and extreme.  The ECMWF model analysis indicates that the storm's central pressure was easily the lowest on record for September in the northern Bering Sea (data since 1950); but more remarkably it appears to have been the lowest for any time of year along part of its track leading up to St Lawrence Island.  The ASOS instrument at Savoonga reported a minimum MSLP of 953.2mb, which matches the ECMWF analysis very well.  Rather remarkably, the storm's center appears to have passed over the island, although extratropical cyclones don't have the calm, well-defined center that tropical storms do.  ERA5 has a 1950-2021 record low MSLP of about 956mb at Savoonga.

Here are maps of the ERA5 September record low MSLP and all-time record low MSLP, with the ECMWF 6-hourly minima annotated:


One word of caution here: the current ECMWF model isn't the same version as the ERA5 reanalysis model, so we'll need to wait a few days to confirm the records in the self-consistent ERA5 system.

Looking back at the formation of the storm, the main culprit was certainly not the size or strength of Typhoon Merbok.  It was only marginally a Category 1 storm in the tropics, with maximum sustained winds of 80mph and minimum pressure of 965mb.  This is almost a non-event as far as West Pacific typhoons are concerned.

The reason that the storm transitioned into such an intense extratropical cyclone was the fortuitous ("unlucky") interaction of not one but two upper-level disturbances with the decaying, northward-moving tropical storm.  Both upper-level disturbances originated in the mid-latitude jet stream over southern Russia, which was unusually strong because of a sharp gradient between a strong trough over the Russian Arctic and a strong ridge from Mongolia to the Sea of Okhotsk.

The first map below (courtesy of Tropical Tidbits) shows the situation a full week ago, with the three key features highlighted: the one to the left is Merbok, and the middle one is a subtle feature that intensified significantly as it moved off the coast of Russia.  Here's the progression at 24 hour intervals:


The first mid-latitude disturbance set up the initial round of extratropical transition and re-intensification for decaying Merbok, but this was quickly followed by another interaction with the third (rightmost) feature when the storm neared the Aleutians.  The one-two punch of mid-latitude jet stream "energy" is what took ex-Merbok to its extreme intensity over the central Bering Sea.  Here's the continued progression at 24 hour intervals up to Saturday afternoon.


More to come on the impacts of ex-Merbok in a subsequent post.


Friday, September 16, 2022

30 Years Ago

Today's (and tomorrow's) Bering Sea storm is a very big deal, and there will be more to say about it as reports roll in from hard-hit west coast communities.  NOAA's Ocean Prediction Center analyzed the storm at a remarkable 937mb this morning, and the Canadians had it at 944mb.  Either way, it's incredibly strong for the time of year, and it may be the lowest MSLP for any time of year at its location (1950-present).  We'll see what ERA5 reanalysis has to say in a few day's time.


Thirty years ago, another major weather anomaly was affecting Alaska: extreme early-season cold.  The September 1992 cold outbreak was outstandingly anomalous, and I'll have more to say about this too in the coming days.  For now, here's a chart of Fairbanks daily mean temperatures compared to the modern normal.

By this point in the month (the 16th), Fairbanks was only a week into the extreme cold anomalies that lasted until early October.  There were 10 inches of snow on the ground, and the low temperature was 12°F on the morning of the 16th (and +4°F in North Pole).  Essentially, winter had arrived, because the weekly average temperature did not reach 32°F again until spring.

The scene is entirely different today.  Here are a couple of glorious Twitter photos that caught my eye in the past few week - one from the Chena River State Recreation Area, and the other from our friend Brian Brettschneider near Anchorage.  Spectacular!


Wednesday, September 14, 2022

West Coast Storm Inbound

Just the other day I mentioned that this summer was one of the windiest on record for the northeastern Bering Sea, and an impending storm is about to ensure that September 2022 goes down in the records book as well.

A typhoon of very modest strength ("Merbok") is currently heading north in the western Pacific, passing the latitude of Japan this evening, and reaching the Aleutians by this time tomorrow.  It has already begun the process of transition from a tropical cyclone to an extratropical cyclone by interacting with the mid-latitude jet stream, and the storm will strengthen and expand dramatically as that process unfolds in the next couple of days.

The west coast of Alaska is going to be hard hit.  Here are forecast maps from the ECMWF model, valid for Friday morning, Friday evening, and Saturday morning.


Rick Thoman, who would know better than anyone what wind and flood risk looks like on the west coast, suggests that the storm's impacts will rival that of November 2011, which has its own Wikipedia page.

The NWS discussion is grim reading:

"The track and strength of this storm moving into the Bering Sea on Friday and Saturday has to the potential to produce major coastal flooding and will likely push significant storm surge into the Yukon River Delta. Water levels with this storm are expected to rival the November 2011 storm. Water levels are expected to rise 5 to 8 feet above normal high tide level along the coast in YK Delta and will push well inland along the Yukon River and surrounding YK delta areas Friday night and Saturday. Water levels in Norton Sound are expected to rise 8 to 12 feet above the normal high tide level and are expected to rise 7 to 10 feet above normal high tide levels along and near the Bering Strait. Hurricane force wind gusts are likely along much of the West Coast as this storm passes."

Here's an animation showing the tropical -> extratropical transition, from Levi Cowan's wonderful site:


For historical perspective, the expected sub-960mb MSLP in the northern Bering Sea will, if it happens, be the lowest MSLP north of about St. Paul Island since at least 1950, according to ERA5 data:


Saturday, September 10, 2022

August and Summer 2022 Climate Data

Climate data is in for August, so let's take a look back at summer 2022 in Alaska.  It will long be remembered for the extraordinary reversal in fortunes with respect to rainfall: after the driest June on record statewide (1925-present), the combined July-August precipitation was the third highest on record, and only 2% below the 1998 record.  This is based on the NOAA/NCEI climate division (NClimDiv) data, which also indicates that July-August was the wettest on record for the northwestern Gulf of Alaska and Cook Inlet divisions (see here for a map of the divisions).

The June dryness exacerbated the moisture deficits from a dry April and May, and of course this was a major reason for the big wildfire season: over 3 million acres burned, the 5th highest in recent decades (only 1990, 2004, 2005, and 2015 were worse).  If it wasn't for the big change in July, the fire acreage would have been much higher still.

The extraordinary contrast between early summer and late summer is illustrated by the following chart, showing the ratio of statewide July-August precipitation to April-June precipitation.  (These statewide numbers from NCEI are area-averages.)  Amazingly, this year's July-August precipitation was nearly 300% of April-June, whereas the highest ratio in all previous years was 180%.  What an extreme climate anomaly!  The distribution isn't Gaussian, but this year's number represents a 6.3 standard deviation departure from the 1925-2021 mean.


Regionally, the contrast was even more extreme in the Cook Inlet division (see below): we're talking about a 10.3 standard deviation departure from the prior distribution.  April-June was easily the driest on record, and then July-August was easily the wettest on record.  In the past century there has been nothing remotely close to this kind of change from extremely dry to extremely wet at this time of year.  I'll have to look into whether anything similar can be identified in the history at any other time of year.


Here are the monthly precipitation rank maps for June through August relative to the past 30 years.  Note that the June and July numbers differ slightly from the maps I posted in earlier monthly summaries (here and here), because NCEI revises the data over time.


For the traditional climatological summer season of June-August, most of the state was considerably wetter than normal, although August did not make up for earlier deficits in the eastern interior.  This includes Fairbanks: the June-August total of only 2.43" is the lowest since 2004 and the 6th lowest since 1930.  It's also a big change from most of the past decade, and it may signal an end to the "new wet regime" that I discussed earlier this year:


ERA5 reanalysis data shows more detail on the persistent dryness in the eastern interior and also supports the fact that August's wet weather did not extend to far southeastern Alaska.
 
 
The contrast in seasonal rainfall totals could hardly have been greater from south to north across the Alaska Range - see below.  Clearly the July-August flow regime, which was produced by a trough over western Alaska, involved downsloping flow from the southwest across the eastern interior, and therefore not much rainfall relief.
 

How about temperature?  The persistent flow regime produced a more striking west-east contrast in August than in July, with temperatures dropping significantly below normal over parts of the eastern Bering Sea and the eastern Aleutians, while eastern Alaska was distinctly warmer than normal.

For the season as a whole, it was a notably warm summer in southern mainland Alaska, although in the southwest this was all because of June.  The North Slope was apparently cooler than normal, but as usual I don't trust the colder result from the NClimDiv data.  UtqiaÄ¡vik was slightly warmer than the 30-year normal, and Umiat was warmer than the 2008-2020 average.


The very active, mobile weather pattern also produced a much winder than normal August in the Bering Sea and most of southern Alaska, and it was one of the windiest summers on record across the Bering and southern Chukchi Seas.

Like the wind and rain, the lack of August sunshine in southern Alaska was very unusual, but that's small consolation for the people who suffered through it.  For the interior, August was much less sunny than June and July, but it was still a very sunny summer overall, compared to normal.


I'll finish with the summer average dewpoint and near-surface soil moisture, as estimated by the ERA5 model.  The western interior had very low humidity in both June and July, and this no doubt contributed to the aggressive fire activity, even though July ended up being fairly wet.  As for the overall low soil moisture in southern Alaska, this reflects the extreme magnitude of the anomaly in June.


Monday, September 5, 2022

Summer Climate Progression

Last month I penned a few comments on the timing of the typical late summer transition to cloudier and wetter weather in Fairbanks.  Traditionally this change is simply known as "August", but it's possible that the timing has shifted over the decades.  I'm particularly interested in the hypothesis that the transition may be occurring earlier now, although I don't have a potential explanation in mind.

I showed this chart in the previous post, and it does send a compelling message that peak rainfall has shifted earlier over time:


However, this only addresses rainfall amounts, which we know have increased dramatically in July in the heaviest rain events (see here).  What about the frequency of wet days?  The chart below focuses on frequency: the top lines are for days with 0.05" or more of liquid-equivalent precipitation, and the bottom curves are for 0.25" or more.


Here we see that there hasn't been much change in the timing of the key transitions over the course of the summer: the frequency of 0.05" events has always peaked in the first half of August, and as expected the heavier 0.25" events peak a little earlier.

The most striking aspect of the frequency chart, at least during summer, is the increase in frequency for 0.25" events all the way through summer, and especially in the last 15 years.  In late July and early August the frequency of these significant rain days has been well over 10% in the last 15 years, whereas it was well under 10% prior to 1990.

It's possible that the increase in frequency of significant rainfall events may partly explain the perception that August weather is arriving earlier these days, because early July now sees the same frequency of major rain events as the August peak used to bring.  But note that this isn't true for lighter rain events, which have changed relatively little over time.

Another angle from which to explore the timing of seasonal changes is to look at upper-level winds.  Fundamentally it is the strengthening of the jet stream that brings cloudier, wetter weather to northern latitudes in late summer, so it makes sense to see if any obvious changes have occurred over the decades.  For example, has the mid-atmospheric westerly flow been gaining strength earlier in summer recently?

In the case of Fairbanks, the answer seems to be no - see below.  Compared to 1961-1990, recent decades have actually seen weaker 500mb westerlies from mid-June through mid-July, although by late July the westerly flow has recovered to the same strength as before.

Below is the chart for Nome, which also shows a more extended window of low westerly flow in the past 30 years, but followed by a sharp increase into August.


Note that the mean 500mb wind actually has an easterly component from the central Bering Sea to southern Alaska in June, because of the tendency for a trough over the southern Bering Sea.  It is the reestablishment of a westerly regime that brings the late summer change in weather patterns.

Here's a map of the change in westerly wind speed from June to August; the biggest increase anywhere in the hemisphere is over Bristol Bay.

The equivalent map for 1961-1990 is similar but does show some differences, most notably over the North Atlantic.

The change in the June->August wind difference (see below) shows that recent decades have seen a greater seasonal wind increase over southern Alaska and in many other locations at similar latitude around the hemisphere.

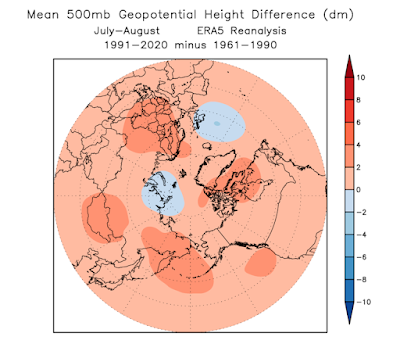
Interestingly, July-August average westerly winds have increased over all of northern Russia and across the Bering Sea to southern and southeastern Alaska.  More work would be needed to dig into the cause of this, but it seems this is related to a relatively strong late summer polar vortex combined with increased ridging (higher geopotential heights) in mid-latitude and sub-Arctic regions (i.e. a stronger pressure gradient).


The 500mb wind speed chart for St. Paul Island confirms the change to stronger westerlies in July and August, and here we might make a case that indeed the seasonal recovery of westerlies has been occurring earlier in recent years.


With a mixed bag of results, I think the safest thing to say in conclusion is that more investigation is required.  I'm intrigued by the idea that a strengthening north-south pressure gradient across the sub-Arctic in late summer may be generating an earlier recovery of the jet stream, leading to more unsettled weather at an earlier date than used to occur; I'll have to come back to this when time permits.