Saturday, October 31, 2020

Sea Ice Update

I haven't mentioned Arctic sea ice since its seasonal minimum a month and a half ago, but in recent weeks an extraordinary situation has been unfolding on the Russian side of the basin, with a rapidly growing ice deficit as freeze-up is delayed across large areas.  The latest graphics from NSIDC illustrate this clearly: ice free waters still exist all the way from the Barents Sea across to the Chukchi and Bering Seas.


In the last several days, the Arctic-wide ice extent has been more than 10% below the previous record low for the time of year, which was in either 2016 or last year, depending on the date.  Here are the October 30 ice concentration images from those two years.  (Note that NSIDC's extent number comes from the area with at least 15% concentration.)


Perhaps most remarkably, the ice extent is now more than 5 standard deviations below the 1981-2010 normal for the date; it crossed this threshold for the first time on record just 3 days ago.  The time-series chart above shows why: the 1981-2010 range of variability tightens up a lot during October, so a much-delayed freeze-up like this year becomes increasingly anomalous compared to that range.

Here's a chart of the annual range of standardized daily ice extent anomalies.  The top of each column is the highest anomaly in the year, for example just below -1 standard deviation this year; the daily ice extent has not been above the daily normal since the spring of 2012.

It's interesting to see the rather steady progression of lower minima every few years; 2007 set a record minimum for ice extent at the time, 2012 set the record that still stands, and 2016 was another very low ice year (especially in the spring and autumn, like this year).  The downward march of ice loss extremes highlights the ongoing trend more clearly than, say, the September ice extent, which arguably has not had much trend since the big meltout of 2007.


Saturday, October 24, 2020

First Zero

The Fairbanks airport thermometer dropped to 0°F for the first time this season yesterday morning; this is a few days earlier than usual.  The chart below shows the date of this annual occurrence, which usually happens after the establishment of permanent winter snow cover (but not in about 10% of years, including 2016, 2017, and 2018).


To me, the interesting aspect of this chart is not so much the lack of long-term trend (as illustrated by the dashed line), but the reduction in variance in recent years.  Since 2009, the first 0°F has not occurred earlier than October 22 or later than November 6, a span of only 16 days; but earlier decades were much more variable.  In fact, fully half of all years from 1930-2009 saw the first 0°F outside the Oct 22 - Nov 6 range; and so the chance of not falling outside that range for 12 straight years is extremely small based on random chance alone.

What might explain the lack of variance in the past decade?  Perhaps the weather patterns have been fundamentally less variable at this time of year; it would take some work to examine whether that is true.

I suspect rather that it's a combination of two factors: first, the overall warming trend, which is very pronounced in the Arctic at this time of year (related to low sea ice), would tend to prevent 0°F being reached at an early date; it's just not cold enough in the atmosphere at large.  For instance, perhaps the +3°F on October 16 this year would have been 0°F in earlier decades.

But a contrary influence may be in play as Arctic weather patterns change in response to the drastic reduction in October sea ice extent; it's possible that late Octobers of the last decade have not produced the kind of weather that keeps temperatures up until a later date.  There's a hint of evidence for this if we look at the average pressure and 500mb height from the last 10 years at the critical time of year:


In general, late October and early November of the past decade have tended to see low pressure over the Chukchi Sea and a ridge over Alaska, and I would interpret this as favoring generally clear skies and calm conditions in Fairbanks - which in turn would favor colder overnight low temperatures at this time of year.  It seems plausible that the Chukchi Sea trough is related to excess warmth and open water there, so the persistent pattern may be developing at least partly in response to the Arctic changes.  I wouldn't want to be definitive about this; but it does seem unlikely to be a coincidence that this particular nuance of Fairbanks climate has changed so noticeably at the very time of year when sea ice reduction might produce its largest effect.


Friday, October 23, 2020

Freezing Drizzle

The Fairbanks scene finally gained a more wintry decoration on Monday, with a couple of inches of snow produced by a weak upper-level disturbance.  But by Wednesday, as strong high pressure developed overhead, a different kind of wintry precipitation developed: freezing drizzle.  According to the airport instrument, drizzle occurred for about 7 hours, with temperatures in the mid 20s.

Here's a previous post on the topic of freezing drizzle.  As noted there, the phenomenon tends to occur more often in early winter than mid-late winter in Fairbanks, and this is consistent with the fact that the saturated lower part of the atmosphere needs to be entirely above about -10°C.  If any part of the cloud is colder, then ice is usually present, and solid hydrometeors always grow preferentially over liquid ones in a mixed phase cloud.

The soundings from Fairbanks at 4am and 4pm Wednesday confirm that the low-level cloud layer was shallow, with temperatures no lower than -10°C, and with dry air above the cloud.


Below are the surface and 500mb analyses from 4pm Wednesday, courtesy of Environment Canada.


With cold air aloft (-34°C at 500mb) and a strong anticyclone in place, one might have expected colder conditions at valley level, but all the moisture kept temperatures relatively high.  This is typical of freezing drizzle situations: in 34 days with freezing drizzle at Fairbanks since 1998, the daily mean temperature was above normal in 32 of 34 cases.

Here's a chart showing the number of hours each winter with freezing drizzle reported by the ASOS instrument at the top of the hour.  This is now the 8th consecutive winter with at least one occurrence.


Saturday, October 17, 2020

A Chill in the Air

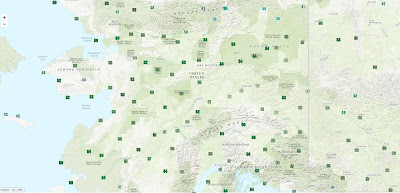
What a difference a week makes.  Interior Alaska temperatures quickly dropped off from a high temperature of 51°F last Saturday, and thermometers marched steadily down through the week, with each day colder than the last until today.  Yesterday was remarkably cold in some spots; here's a round-up of low temperatures yesterday morning (click to enlarge).


The -11°F (actually -12°F) at Smith Lake on the UAF campus is quite impressive for the date, although the sensor is in a serious cold spot.  Fairbanks airport only made it down to +3°F.

Here's a look at the seasonal plunge over the last 3 weeks as registered at the Smith Lake site.


The Salcha RAWS measured -9F, and not surprisingly the river there is already iced up.  Here's a beautiful photo from this morning, courtesy of Twitter user NateoftheNorth.  You really should click to enlarge this one.


Despite the cold, measurable snow still hasn't arrived in Fairbanks, with just a trace reported on Wednesday and Thursday.  It's interesting to consider the coldest conditions that have ever occurred prior to measurable snow: back in 1941, the temperature dropped to -6°F on October 14, and snow wasn't measured until 4 days later.  This year's +3°F ties with 1969 for second coldest prior to having snow on the ground.

If we look at accumulated cold as measured by total freezing degree days, then this year is so far in 3rd place for cold prior to any snowpack.  2016 also had a decent freeze prior to the October 20 first snowfall, but most years have little or no freeze-up prior to snow; the median FDDs is zero.


Saturday, October 10, 2020

Warmth Will End

Exceptionally warm weather has continued across interior and northern Alaska, with Fairbanks currently sitting at the 3rd warmest start to October on record (1930-present); only 1969 and 2003 were warmer.  As of today, the normal daily high temperature is 36°F, but the coldest day so far this autumn was only 42°F back on September 24.  The average high temperature so far in October has been 56°F.

Fairbanks airport also hasn't seen even a flake of snow, and we're two and a half weeks past the date when that normally happens.  The median date for first snow is September 22, and about 85% of years receive measurable snow on the ground by October 10.  However, it looks like the white stuff will arrive next week, so the record for latest first flakes (October 20 in 2018) won't be threatened.

One might be tempted to think that such a warm spell in late autumn would portend a mild winter, but in fact there's a slight inverse correlation between September and subsequent November-March temperatures in the interior.  And as I mentioned a couple of weeks ago, with La Niña under way in the tropical Pacific, a cold winter is more likely than a warm one in interior, southern, and southeast Alaska.

Speaking of La Niña, the latest guidance from long-range forecast models has become considerably more bullish, and it's looking increasingly likely that this La Niña will end up as one of the stronger events of recent decades.  The models have also come into dramatically better alignment on expected cold for much of Alaska; here's the latest multi-model ensemble mean anomaly for January-March, which has the coldest 3-month period in the forecast.


The inter-model agreement is unusually good, as all of the models are now being heavily influenced by the La Niña forcing (see below).  One comment on this: confidence in the forecast is not as high as this agreement would suggest, because much depends on the evolution of the Arctic Oscillation and other high-latitude patterns, and these are much less predictable than the standard La Niña influence.  The models are good at showing the overall influence of La Niña, so they inevitably look similar in these situations, but other aspects of the winter circulation pattern can easily modify the outcome at middle and high latitudes.

It's really very interesting that the forecast for the upcoming late winter period (January through March) looks very similar indeed to the outcome last year across most of the extratropical Northern Hemisphere - compare the two maps below.  There's remarkable similarity across the North Pacific domain in particular, but of course the tropical Pacific is much different: last winter wasn't a La Niña at all, as we noted at the time (see here), but it looked a lot like a La Niña outcome in Alaska.

For reference, here's the January-March temperature anomaly in 10 strong La Niña events of the past.


Finally, the maps below show the monthly progression of NMME forecast maps.  Note that the cold signal doesn't come into play at all until December, and it peaks in February.  But as noted above, this is just the model signal, influenced mainly by the La Niña forcing; don't put too much faith in it, as there will inevitably be much more variability from month to month.


Sunday, October 4, 2020

Much Bigger Chinook

Following on the heels of last weekend's Brooks Range chinook, a much more significant warm event has unfolded across much of the state in the past few days, with deep and strong flow from the south rather than low-level flow from the north.  Here's the 500mb setup at 4pm AKDT on Friday; the big western Canada ridge and Bering Sea trough are classic for a warm surge into mainland Alaska.


The result has been one of the most notable warm episodes on record for the time of year; Fairbanks has exceeded 60°F for the past 4 days, with 68°F on Thursday and 66°F on Friday.  This is only the 4th year since 1930 with 65°F or higher in Fairbanks in October.  It's also the first time since the 1930s that Fairbanks has seen a daily low temperature above 45°F after September (the low was 47°F on Friday).

In terms of departure from normal, Friday's mean temperature anomaly of +22°F was one of the largest daily departures from normal on record prior to mid-October.  The greatest, of course, occurred in the extreme chinook of September 1995, when a low temperature of 65°F occurred on the 20th of the month, followed by a high of 78°F the next day.

Readers may recall that I mentioned the 1995 event in this post back in July, when I noted that 1995, like this year, saw its highest temperature of the year in May.  It's interesting that 2020, like 1995, has produced highly unusual warmth in both May and in mid-autumn, while some of the major global climate drivers are similar (developing La Niña during summer, a very warm North Atlantic, and a very active Atlantic hurricane season).

Here's a look at high temperatures on Thursday the 1st (click to enlarge).  That's a lot of 60's, including at Chicken in the southeast interior; the co-op site (not shown here) had 61°F, which is only the second time with 60s in October (previously 64°F on Oct 2, 2003).


And the following map gives a sense of the scale of the departures from normal, based on gridded model data:

Finally, what if the similarity with 1995 persists?  Then we would expect a cold start to winter in the interior; the winter of 1995-96 was colder than normal through January, particularly in eastern and southeastern Alaska.  January was particularly cold in the southeast, with Northway seeing a monthly mean temperature of almost -30°F: about the same as last year, in fact.  Juneau also had their coldest January of recent decades in 1996.