Thursday, June 29, 2023

Almost Zero Fire

The contrast in wildfire activity between Alaska and Canada so far this season is very extreme.  Canada has just surpassed their all-time record for annual fire acreage - in June! - but meanwhile Alaska's fire acreage is at a record low for the date.


The reason?  The upper-level circulation pattern just won't budge.  This month's 500mb height anomaly has been very similar to last month's, with a trough axis near western Alaska and unusually high pressure over central Canada.


The lower-atmosphere temperature pattern has mirrored the upper-level circulation anomaly, with (according to NCEP reanalysis data) below-normal temperatures from the Chukchi Sea to western and southern Alaska, but very unusual warmth in central Canada.

Lightning has been much less widespread than normal across the Alaskan interior, and fire fuels haven't really dried out.

It's fascinating to see the near-complete absence of Alaska fire even as El Niño has emerged and is strengthening.  I made some comments on the ENSO-fire relationship in a couple of posts last month, and I'm sure I'll return to the topic again this summer.  But for now I'll just note how remarkable it is that last season was very active despite an entrenched La Niña, and this year is record inactive (so far) despite an increasingly robust El Niño.  As so often happens with seasonal forecasting, just when you think you've found a strong historical relationship - everything changes.


Friday, June 23, 2023

Temperature Trend Follow-Up

While the topic is still fresh in my mind, I did some follow-up on Wednesday's question about whether the ERA5 temperature trends are realistic for Southeast Alaska.  Specifically, I wanted to compare the ~9km resolution ERA5-Land data to the ~30km ERA5 reanalysis.

According to ECMWF, ERA5-Land "adds value to ERA5 surface fields and provides users with a more accurate dataset for surface applications.  The impact can be particularly important over complex terrain, where accurate orography is very important."

This sounds promising for Southeast Alaska.  Here's a visual comparison of the 1957-2021 linear trend in 2m temperature from the two sources: ERA5 on top (the data I looked at on Wednesday) and ERA5-Land below.

Clearly the ERA5-Land trend is smaller overall in this region, and it does not reach such high values in some of the areas of high terrain.  Also, the ERA5-Land trend values are obviously much lower over the coastal islands of Southeast Alaska.

Here's the elevation versus trend analysis for all grid cells within the Panhandle climate divisions: ERA5 on top, ERA5-Land below.

The highest trends are significantly lower for ERA5-Land than for ERA5, and the lowest elevation grid cells have trends that are quite consistent with the results from the climate divisions (~0.16°C/decade) and from Sitka and Juneau (0.14 and 0.26°C/decade).  Contrast this with the area-average ERA5 trends of 0.44-0.55°C/decade for the Panhandle climate divisions, as presented in the new paper by Ballinger et al.

In my view, these ERA5-Land results strengthen the argument that the coarse-resolution ERA5 data produces unrealistic trends for Southeast Alaska as a whole, and especially if we're interested in the low elevations where most people live.  Given the obvious shortcoming of the coarse ERA5 data, and the likelihood that ERA5-Land still isn't quite right, I think we should accept the NCEI climate division trends as more representative of reality, especially for inhabited locations; and arguably then inhabited Southeast Alaska may have the smallest warming trend of anywhere in Alaska.


Here's a comparison of the ERA5 vs ERA5-Land linear trends for each climate division: the ERA5-Land trends are slightly higher for the west and interior, but much lower for the Northeast Gulf and Panhandle divisions.

Division
ERA5ERA5-Land
North Slope
0.550.55
West Coast
0.370.39
Central Interior
0.350.36
Northeast Interior
0.380.41
Southeast Interior
0.280.32
Cook Inlet
0.310.30
Bristol Bay
0.340.32
Northwest Gulf
0.260.25
Northeast Gulf
0.370.31
North Panhandle
0.550.41
Central Panhandle
0.490.32
South Panhandle
0.490.32
Aleutians
0.200.19

And finally, a statewide comparison in map form:


Wednesday, June 21, 2023

New Paper on Climate Trends

A new study was published a couple of weeks ago, documenting the changes that have occurred in temperature, precipitation, snowfall, and sea ice around and across Alaska since 1957:

Alaska Terrestrial and Marine Climate Trends, 1957–2021

Rick Thoman, founder of this blog, is one of the co-authors.

The paper provides a nice summary of the main climatic changes over the 65-year period, and I recommend taking a look.

The two key data sources for the analysis are the ERA5 reanalysis and the NOAA/NCEI climate division data, the same two sources that I often use to look at monthly and seasonal anomalies.  Both sources have their advantages and drawbacks.  In principle, it's more appealing to use "ground truth" data from climate observing sites (the NCEI or "ACD" data), but in practice the scarcity and quality of Alaska's climate observations are so problematic that the ERA5 (modeled) data is sometimes preferable.

In terms of climate trends, one of the more eye-catching discrepancies between the two data sources is the disagreement regarding temperature trends for Southeast Alaska.  Here's Figure 3 from the paper (click to enlarge):


Remarkably, ERA5 shows a 65-year temperature trend that's about 3 times the NCEI trend for the Panhandle climate divisions.  The paper notes this discrepancy in passing, commenting "topographic complexity presents challenges for regional trend estimates", but no further investigation is performed.  The authors seem to accept the ERA5 values as more realistic, as the article's abstract and conclusions cite the very large trends in the North Slope and North Panhandle regions.

I decided to look into this a bit more.  The figure below illustrates the discrepancy for the North Panhandle climate division in particular.


The two data sets show a drastic difference in trend, and it's fairly consistent over time, i.e. not obviously caused by a few "bad" years in one of the sources.

Here's a look at the annual data from two key sites in Southeast Alaska: Sitka and Juneau - see below.  The trends at these sites tend to support the NCEI (ACD) result, with much less warming than ERA5.  In particular, the relatively warm years of the late 1950s and early 1960s are on par with the modern climate, whereas the ERA5 data shows much cooler conditions in the earliest years of this analysis period.


A map of the ERA5 trend gives a hint as to what might be going on.


Notice that ERA5's 2m temperature trend over the Gulf of Alaska is small - less than 0.2°C/decade generally, and around 0.1°C/decade near the Alaska Panhandle.  But over the Panhandle itself, the trend is very high - locally in excess of 0.6-0.7°C/decade.

Given that the ERA5 resolution of 31km is far too coarse to resolve the complex topography of southeastern Alaska, the ERA5 temperature represents modeled averages over grid cells with a mean elevation well above sea level.  In contrast, the NCEI trends are derived from climate observing sites, most or all of which are very near sea level.  Therefore it's hardly fair to expect consistency between the two sources: ERA5 is most definitely not modeling conditions at sea level.

Digging a little deeper still, I pulled out the temperature trends for every ERA5 grid cell that has more than half of its area within the Panhandle climate divisions.  The following chart illustrates the relationship between trend and grid cell elevation.

While the overall correlation is not particularly strong, the very lowest elevation grid cells have easily the smallest temperature trends, and all of the trends above +0.6°C/decade are found for grid cells at more than 400m elevation.  This supports the idea that sea level sites in the Panhandle have not in fact experienced the drastic warming that the ERA5 data suggests at first glance.

Out of curiosity, I also calculated the ERA5 temperature trends in the "free atmosphere" at 925mb and 850mb, i.e. about 2500 and 4500 feet above sea level, depending on the time of year.  (In locations where the land surface is above these pressure levels, the model fills in the data with an extrapolation as if the ground were not there, just for convenience/completeness.)


The temperature trends over Southeast Alaska are much smaller aloft, and there's also much less contrast between ocean and land, as we would expect.  Evidently, then, ERA5's very large surface temperature trends in the complex terrain of Southeast Alaska (and nearby western Canada) are not just a reflection of high temperature trends in the free atmosphere aloft.

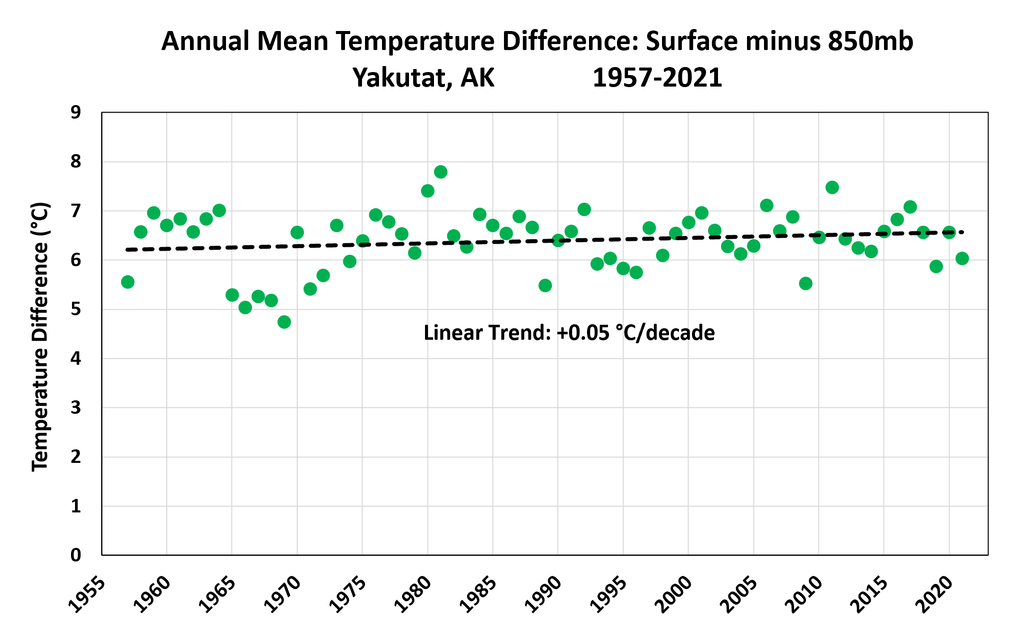
Finally, to confirm that nothing surprising is going on with the trends aloft, I used sounding data from Yakutat to look at the temperature difference between the surface and 850mb.  There's a slight but insignificant upward trend:


In conclusion, I think there's a serious question as to whether the long-term temperature trends are realistic in the ERA5 2m temperature data for Southeast Alaska.  It is possible that there has been drastic warming at the higher elevations and that ERA5 is capturing that properly with its coarse grid cell averages, but the ERA5 2m temperature trends do not appear to correspond to either sea-level trends or free-atmosphere trends.

Next steps in this investigation might be:

- Look for long-term "ground truth" temperature data at relatively high elevation in Southeast Alaska; there might not be any.

- Examine the ERA5-Land data, which is a downscaled version of ERA5 at 9km resolution.  This might have a better chance of reproducing trends in the complex terrain.

Sunday, June 11, 2023

May Climate Data

Looking back at the month of May, there were a number of extreme weather events across Alaska, and as always I recommend Rick Thoman's blog for many of the details.  For the month as a whole, the statewide average temperature ended up on the verge of the "below normal" tercile, but it was a mixed bag, with unusual warmth more prevalent in the east and north.  Cold in the west wasn't extreme, but it was notable.


Statewide precipitation was more unusual - tied with 2018 for second highest in the past 30 years.  It was the wettest May on record for the Southeast Interior climate division, with the extreme rainfall near Glennallen at the end of the month being largely responsible for that statistic (Rick has more details on the event).  The ERA5 reanalysis data doesn't seem to have fully picked up on the event, which probably shouldn't be surprising given the complex terrain around the Copper River Basin and the likely localized nature of the heaviest rains.

As for wind and clouds, May brought a lot of both for southern Alaska, and especially from Bristol Bay to the Kenai Peninsula.


The 500mb anomaly map shows why: a trough axis was stuck between the ridge to the south of the Aleutians (associated with very unusual ocean warmth) and a powerful ridge over Canada (producing the very active early fire season there).

Many readers will recognize the negative PDO pattern in the SST map above: cold in the near-Alaskan waters and along the west coast of the lower 48.  But interestingly, it's not cold from Southeast Alaska down to Washington, and that's unusual for a negative PDO regime.

Looking more widely at the Arctic, May was very warm on opposite sides of the Pole, both in north-central Russia and in north-central Canada.

The departure from normal reached 3 standard deviations in both areas.

Appending the last few months to previous results, it's becoming obvious that the Arctic land area as a whole has settled back into a slightly cooler regime compared to the warmth that prevailed for 5 years after the 2015-16 El Niño - see the black line in the chart below:


But it's unlikely that the "cool" regime will prevail much longer.  Global (excluding Arctic/Antarctic) average sea surface temperatures have been at a record high for more than two months now, and that's before the main effect of the emerging El Niño is felt.  Not to be alarmist, but it does seem very likely now that global temperatures will not just break but smash previous records in the next year or so, and the Arctic will very likely follow suit.


Thursday, June 8, 2023

Sea Ice Update

I don't think I've made any significant comments on Arctic sea ice since the autumn, so let's fix that shortcoming.  First, the data from recent months shows that ice extent was nearly the lowest on record at the time of its recent seasonal peak, but a relatively cold spring across the Arctic marginal seas has allowed a modest recovery.

Two significant areas of ice deficit are obvious on the May map from NSIDC: in the Barents Sea to the northeast of Scandinavia, and in the Gulf of St Lawrence.  Both regions had a very warm winter.


Overall, May extent was greater than in most of the last decade, but of course still well below typical pre-2000 levels.


The only part of the Arctic with above-normal ice extent for January through April was the Greenland Sea, i.e. the Atlantic waters between Greenland and Svalbard.  Ice extent there was about 8% above the 1991-2020 median, but that doesn't amount to much of the Arctic overall.

Bering Sea ice was slightly below the 1991-2020 median and less than last year, but it marked the fourth winter of relatively near-normal ice after the big deficits of 2018 and 2019.


The chart below shows that this winter lagged 2021-22 nearly all the way through, but the cold April allowed ice to hold on relatively late at the end.  According to Rick Thoman, sea ice persisted near St. Matthew Island through the month of May for the first time since 2013.


The big question now is, what will the big El Niño episode do to sea ice in the next 12-24 months?  El Niño was "officially" declared today by the Climate Prediction Center, and there's little doubt that it will be a strong one.  The pulse of global-scale warming is likely to be amplified in the Arctic, and I'll be quite surprised if ice extent doesn't see another leg down in due course.


Saturday, June 3, 2023

Record Late Snow in Bettles

With climate observations back to 1951, Bettles has not previously recorded measurable snow in June, but yesterday the observer there reported three-tenths of an inch of snow.

The temperature was slightly above freezing, so it didn't last long; but a bit more light snow occurred this morning.  What a way to start summer.

Here are a couple of webcam photos that I happened to grab yesterday morning.  It was 2am in Bettles, and broad daylight of course, being just north of the Arctic Circle.


This leaves only July without measurable snow in the climate history of Bettles.  As far as August is concerned, there's only one event, but it was the real deal: 2.6" on August 9, 1969.  It fell in the middle of the day, and there was still 2" on the ground the next morning, with a low temperature of 26°F.

In Fairbanks-land, a NWS meteorologist reported a good covering on top of Murphy Dome last night - enough to ski on - and all of the SNOTEL sites above 1800' elevation have reported snow on the ground for the last 3 days.

Remarkably, this appears to be the first time any of the SNOTEL sites (7 of them in the hills above Fairbanks) has seen accumulating snow significantly after meltout.  The only time any of them has seen snow after meltout at all was at Teuchet Creek, which is the lowest in elevation and typically melts out earliest (May 7 average); and in those cases (1999 and 2021) there was only a single day between meltout and a brief return of snow around the beginning of May.

For most of the sites with snow (all but Munson Ridge and Upper Chena - the two highest) it's also the latest on record with snow on the ground.

However, the period of record is only about 40 years: 5 of the 7 SNOTEL sites were installed in 1980 or 1981.


Thursday, June 1, 2023

Cold Start to Summer

The calendar says that climatological summer (by convention) is here, but Alaska is suffering a major seasonal setback.  Residents of the Fairbanks area were sharply reminded of their high latitude this morning, with below-freezing temperatures in many locations.  Here's a map showing some of the low temperatures that occurred earlier today (click to enlarge):

The low temperature at the international airport was 33°F, the coldest this late in the season since early June 2006.  Back then the airport reached 29°F on June 4, which is the June record for the official climate site in Fairbanks.  The air mass was definitely colder in 2006; this morning's balloon sounding from Fairbanks recorded a temperature of -5.9°C at 850mb, but the 2006 cold snap produced -9.3°C at 850mb.

As is typical, other sites around Fairbanks were significantly colder than the airport this morning.  Eielson AFB saw 28°F, and the Goldstream Creek co-op observer measured 23°F.  The Goldstream Creek reading is one of the lowest temperatures on record in the Fairbanks area for the month of June, although again 2006 was colder (and the GC co-op site wasn't operating back then).  Locations in the hills saw temperatures around 20°F on June 4, 2006, the Fairbanks RAWS reported 21°F that day, and the Salcha RAWS saw a remarkable 15°F the next day.

Unusual cold also persists in western Alaska.  I've mentioned Kotzebue a few times recently, but it's remarkable to see that they had a high temperature of only 30°F yesterday, and today it looks like they will fail to break the freezing mark again.  Yesterday was the coldest day this late in the season since 1974 in Kotzebue; and it's been snowing off and on.

Here are a few tweets highlighting snow in both western Alaska and the southeastern interior.


Precipitation amounts have been quite substantial for the central and eastern interior in the past few days - see the estimates below.  This is exacerbating the high water situation for many creeks and rivers, leading to some new flood advisories and warnings.  There's still snowpack on the highest terrain of the interior, although meltout appears to have reached above 3000' elevation near Fairbanks - the Munson Ridge SNOTEL melted out on May 27.