The snow is going quickly at valley-level around Fairbanks, more quickly than expected, as there were several very warm days in the past week. Thursday's high temperature of 58°F was nearly a record high for the date, and the daily mean temperature of 46.5°F was very nearly the earliest on record for such warmth. Today's official measurement of snow depth for Fairbanks is 10 inches, down from 21 inches a week ago.
It's interesting to observe that there's no significant long-term trend in the date of meltout in Fairbanks. Meltout is defined here as the first date with zero snow or a trace of snow on the ground, where a "trace" means less than 50% area snow cover OR more than 50% but too little to measure (less than 0.1 inches).
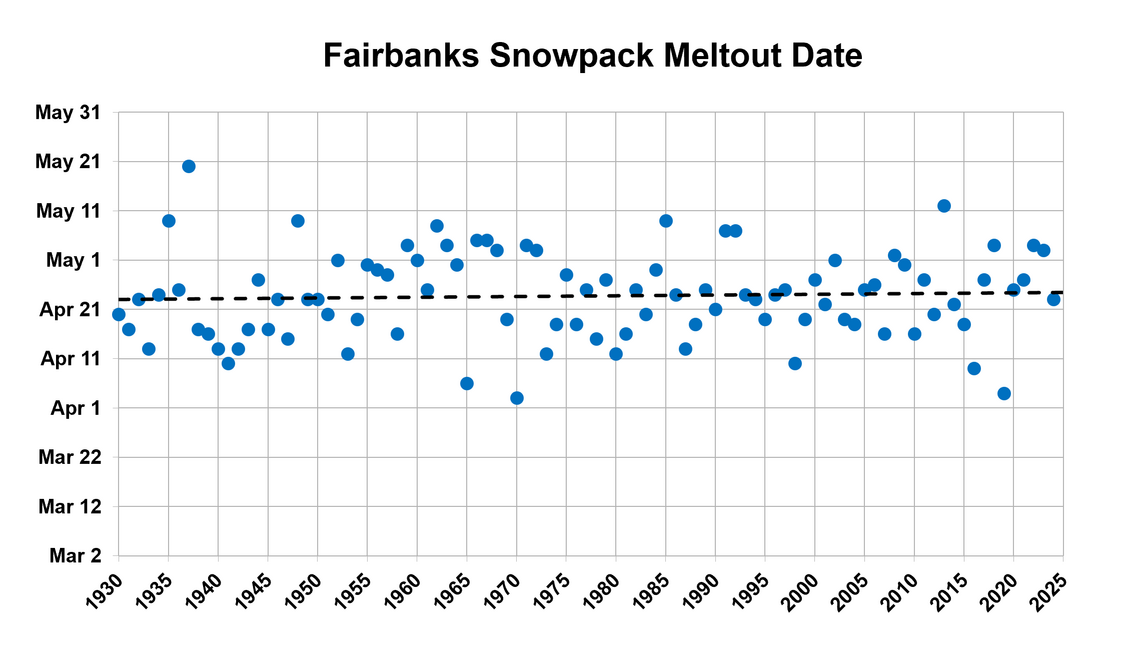
The absence of long-term trend is more than a little surprising in view of the fact that average temperatures have risen substantially at this time of year:

There may be several possible reasons for this discrepancy, but digging into them is a topic for another day. Two obvious possibilities are (a) snowpack water content has increased, offsetting the increased warmth; and/or (b) changes in measurement location and/or method have influenced the meltout dates. The measurement location certainly has changed a few times, most recently just a few years ago when (I believe) the location changed from the airport to the university's West Ridge campus.
But on to the main topic of today's post. I was interested in a spatial view of meltout trends across Alaska, so I used ERA5 reanalysis data to take a stab at this. First I examined whether ERA5 is able to capture year-to-year variability in meltout for two locations with reliable long-term snow depth data: Fairbanks and Bettles. The results are quite encouraging, with correlations of 0.86 (Fairbanks) and 0.89 (Bettles) since 1950.


Note that I used slightly different definitions of ERA5 meltout for the two locations, based on trial and error. For Fairbanks I found that the correlation of ERA5 and observed dates is best when "ERA5 meltout" is defined as the date when ERA5 snow water equivalent (SWE) drops below 0.5cm (liquid equivalent), whereas for Bettles a threshold of 1.0cm works slightly better. Encouragingly, not only are the year-to-year correlations optimized at these thresholds, but the average dates line up too, i.e. the ERA5 dates are not systematically earlier or later than the observations. This in itself is quite surprising; I frankly did not expect the model to do this well.
(Note that using zero SWE for ERA5 meltout is not reasonable, because the ERA5 grid cells are almost 20 miles wide and include higher elevations where snow lingers much longer.)
It's interesting to see that, unlike the official Fairbanks observations, ERA5 shows a substantial trend towards earlier meltout in the Fairbanks area. The ERA5 result is perhaps more like what we would expect in response to the temperature trend; so this does make me wonder about the representativeness of the historical snow cover record from Fairbanks. In Bettles the ERA5 trend is less than at Fairbanks, and it's also closer to the "ground truth" trend.
Finally, having established that 0.5cm SWE is a reasonable threshold for ERA5 meltout, here's a map of the ERA5 trend across the state.

A 75-year trend of 1-2 days/decade is widespread across central, western, and northern regions, corresponding to about 1-2 weeks of change since 1950. However, more rapid trends are evident in southern areas. Note that I have only calculated the trend in locations where the ERA5 snowpack reached at least 0.5cm in every year, and I also excluded locations where meltout did not occur by July 1 in any year; so the analysis is only for areas with a completely reliable late winter snowpack that then always melts out before summer.
Here are maps for North America and for the Northern Hemisphere, using the same 0.5cm SWE threshold for meltout (and I don't know how well that works in other regions). Click to enlarge. There are a couple of small zones with slightly positive trends: in interior northern Canada and in far northern Finland. But overall the picture is one of dramatically earlier meltout, especially in the more southern latitudes.


n Fairbanks the winter rains sure soaked the ground and any layer of snow above. What's left a valley floor is a partial reflection of those events. We have some ponding here and there that seems above normal....the street drains sure required steam to clear earlier this month.
ReplyDeleteWinter rain sure does bring an abundance of difficulties.
Delete