Wednesday, August 31, 2016

ENSO Update

It's been a while since we looked at the current phase of ENSO (the El Niño - Southern Oscillation), so let's do an update.  As I'm sure readers know, last winter's intense El Niño episode is long gone now, as equatorial Pacific sea surface temperatures dropped back to normal in the spring.  In the past couple of months temperatures have become modestly lower than normal in the central and eastern equatorial Pacific Ocean, so we're close to marginal La Niña conditions, but La Niña has not yet been declared.  Here's the latest weekly SST anomaly map, showing rather feeble cool anomalies along the equator.  Note the extraordinary warmth all around Alaska, a result (and a cause) of the exceptionally persistent warmth all year.


As last winter's El Niño event unfolded, there was much speculation that the next winter, i.e. 2016-2017, would be a La Niña winter, because a quick reversal into La Niña conditions has occurred before after El Niño; for example, this happened in 2009-2011 and in 1997-1999.  For a while the seasonal forecast models were showing this kind of scenario, with a significant La Niña developing this autumn, but the models have now backed off.  Compare the two charts below, the top taken from CFSv2 runs initialized in late April, and the bottom from the most recent runs.  The latest forecast shows the key Niño3.4 region getting no colder than at present, but actually warming as we go through winter.


The latest IRI/CPC forecast for ENSO still shows a greater chance of La Niña than ENSO-neutral conditions until late winter, but the outlook is quite different from a few months ago, when the chance of La Niña was believed to be above 75%.


So given that La Niña is on hold if not cancelled this winter, we'll be reverting to the PDO as a seasonal forecast tool for Alaska this winter, correct?  Unfortunately, perhaps not - because the PDO index crashed about a month ago and near-neutral conditions have prevailed since then.


With near-neutral ENSO and PDO conditions at the present time, and ENSO-neutral looking like a reasonable bet for the coming months, we would not expect to be able to say much about what might unfold this winter in Alaska.  It is interesting to note, however, that Papineau (2001) showed results indicating that ENSO-neutral winters are warmer on average than El Niño winters from Barrow down the west coast to Cold Bay; the rest of the state tends to be cooler than during El Niño, but nowhere near as cold as during La Niña.  On this blog we've seen that the warmest January's in Fairbanks have tended to occur during near-neutral ENSO conditions; so it would not be a surprise to see warmth persist this winter, especially if surface temperatures don't cool off relative to normal in the Gulf of Alaska and Bering Sea.

The latest CPC forecast for December-February expects neither warm nor cold conditions, relative to normal, over the southern half of the state, and they also show equal chances for precipitation over the interior.  Recall that this doesn't mean CPC is forecasting near-normal; they just don't feel able to make a call one way or the other.  Hopefully a clearer picture of likely anomalies will emerge in the coming months.


Friday, August 26, 2016

Wet in the Northwest

Parts of northwestern Alaska have seen very heavy rainfall in the past week or so, as very moist southwesterly flow has been drawn up into the western Brooks range.  The highest rain totals were observed at the high-quality CRN site near the Red Dog mine, about 30 miles north of Noatak and 45 miles northeast of Kivalina.  The CRN instruments sit at an elevation of 942 feet above sea level with higher terrain to the north and northeast, so flow from the south or southwest is favorable for heavy precipitation.  The station reported 4.97" in 3 days ending on the 20th, with 2.89" on the 19th alone.

Heavy rainfall continued in the subsequent days at points farther to the east in the western Brooks Range; the following images show the NWS estimates of precipitation over several consecutive days (with one image missing for the 23rd - sorry):


It's no surprise to see the NWS issue an advisory today for high water levels on rivers in the area.  As noted by the NWS, the flow of the Kobuk River near Kiana has more than quadrupled in the past week:


Here are a couple of soundings from Kotzebue that show the strong southwesterly low-level flow around the time of the very heavy rainfall at Red Dog.  The sounding at 4pm AKDT last Friday reported 45 knot winds from the southwest at 3000 feet above sea level, transporting copious moisture into the hills to the north.


As remarkable as 5" of rain in 3 days seems at a latitude of 68°N, it's apparently not that unusual for the Red Dog CRN site, which has been in operation for exactly 6 years today.  The chart below shows the monthly precipitation totals (liquid equivalent), and we see that not only was last August also very wet, but August 2012 produced an extremely large amount of rain at the site.  Given that August 2012 was also by far the wettest month on record at nearby Kivalina, with a remarkable 8.8" of rain, the extreme Red Dog total is plausible.


It is no coincidence that August 2012 also produced the strong Arctic cyclone that we discussed in connection with the recent Arctic storm; the circulation pattern this month, with low pressure to the north and northwest of Alaska, is broadly similar, although this year the main anomaly is farther to the north and away from Alaska.  Here's a map of the sea-level pressure anomaly in August 2012.


It is interesting, to say the least, that August has been so consistently wet at Red Dog in the past 5 years.  The figure below shows the distribution of precipitation totals for each month of the year, with the columns showing the absolute range and the horizontal markers indicating the median for each month.  It's intriguing to consider whether August has always been by far the wettest month of the year in this area, or if the past several years have been very anomalous compared to the longer-term climate.  I suspect the latter is more likely to be true.


Finally, for context and future reference, here's the setting of the Red Dog site as visualized on Google Maps and from the FAA webcam view.  The CRN site appears to be just visible on the webcam view, just to the right of the road as it heads away from the airport to the southwest.


Monday, August 22, 2016

No Freeze Yet

None of the usually colder reporting sites around the Fairbanks area has seen a freeze yet this month, and this is unusual compared to recent years.  The normally chilly Goldstream Creek and Ester 5NE (Goldstream Valley Bottom) COOP sites came close a few days ago, with both sites reaching 33°F, but the closest site to Fairbanks to hit 32°F so far is a COOP site 20 miles southeast of Delta Junction.

Looking back at the past 10 years, here are the coldest temperatures reported by August 22 in the general vicinity of Fairbanks:

Aug 9, 2006   29°F   Ester 5NE COOP
Aug 10, 2007   30°F   Fairbanks RAWS
Aug 12, 2008   28°F   North Pole COOP and Ester 5NE COOP
Aug 20, 2009   23°F   Fairbanks RAWS
Aug 22, 2010   26°F   Fairbanks RAWS
Aug 6, 2011   30°F   Mile 42 Steese Highway COOP
Aug 22, 2012   25°F   Ester 5NE COOP
Aug 22, 2013   30°F   Mile 42 Steese Highway COOP
Aug 22, 2014   27°F   Ester 5NE COOP
Aug 15, 2015   31°F   Goldstream Creek COOP

The last time the first freeze report came in later than August 22 was in 2004, when it occurred on the 25th.  That year also saw Fairbanks airport stay at or above 45°F until the 28th, the latest on record; but if current forecasts are to be believed, that record may be in danger this year.

The chart below shows daily low temperatures at Ester 5NE this summer.  In the 18 years that this COOP site has been operational, freezes have been recorded even in the height of summer - for example:

31°F   June 25, 2009
31°F   July 4, 2002
31°F   July 9, 2012
31°F   July 20, 2011
30°F   July 21, 2014

Consider this as a metric of how persistently mild it's been this summer: the low temperature at Ester 5NE stayed at or above 40°F for 54 consecutive days this summer; this is more than double the previous record of 25 days, set in 2005.


Thursday, August 18, 2016

Drier and Warmer

Fairbanks has been enjoying a spell of delightful late summer weather recently, which I'm sure is most welcome after the very wet weather of June and July.  The past week included the longest dry spell since mid-May, and 14 of the past 15 days (including today) have reached 70°F; but it hasn't been excessively warm, as the temperature hasn't reached 80°F since the mid-July heat wave.


It's interesting to note that the average daily high temperature so far this month is 71.9°F, which is higher than last month's average: so far, August days have been warmer than July days, which is unusual.  If the anomaly continues and August ends warmer than July for high temperatures, it will be only the 4th time this has happened in Fairbanks history (1930-present) - and the previous occasions all followed very cool July's, unlike this year.  But note that August has never been warmer than July in terms of overall average (daily mean) temperature, and it's very unlikely to happen this year.

The warmth in Fairbanks this month is consistent with, and merely a small part of, the ongoing exceptional warm anomaly that has affected the state of Alaska all year.  The chart below shows the daily average of temperature anomalies during the last year for 25 stations scattered around the state, from Annette Island to St Paul Island and across the interior up to the Arctic coast (credit to Rick Thoman for devising this kind of analysis).  According to my calculations, the statewide index has been below normal only 2 days so far this year, and that by only the smallest of margins; the persistence of the warm anomaly is quite astonishing.


Monday, August 15, 2016

Strong Arctic Storm

A very strong low pressure system developed over the Arctic Ocean north of Siberia yesterday and intensified last night as it migrated eastward to the date line.  This morning the Canadian surface analysis estimated the minimum central pressure at 969mb, which is very low for the time of year.  The sequence of images below shows some analyses from the past 36 hours.

3am AKST yesterday:


3pm AKST yesterday:


9am AKST today:


The current position and intensity of the storm is quite reminiscent of the 2012 "Arctic hurricane" (documented here on this blog), although today's storm tracked from the west rather than the south, and it's not quite as strong as the 2012 storm.  The higher overall latitude of this storm may mean that the associated high winds do less damage to Arctic ice than the 2012 event; the 2012 storm is believed to have been one of the factors that led to that year's record low ice extent.  Today's chart of sea ice extent from the NSIDC conveniently shows the comparison of recent conditions to 2012 - see below, and note the dip in early August 2012.  This was probably at least partly caused by the storm, and so we may well see a similar sudden dip in sea ice extent in the next few days.


The current storm and that of August 2012 appear to be consistent with a long-term trend towards stronger storms during summer over the portion of the Arctic north of Alaska; see the chart below, created from the NCEP/NCAR global reanalysis.  One caveat here is that the reanalysis system ingests oceanic weather reports, so it's possible that the paucity of observations over the Arctic in earlier years prevented the reanalysis from fully capturing all the storms that actually occurred; however, the model is very capable of transporting information from data-rich to data-sparse areas, so this may not be a significant issue.  Here's an NSIDC article giving some additional perspective:

http://nsidc.org/cryosphere/icelights/2013/08/are-arctic-cyclones-chewing-sea-ice


[Update August 16] Here's a chart of observed sea-level pressure at a buoy that happened to be located very close indeed to the track of the storm center.  If the measurement is accurate, then the storm was a little stronger than estimated by Environment Canada.


Saturday, August 13, 2016

Colville Delta Dryness

Reader Tracy recently asked about conditions around the Colville River delta of the North Slope this summer in light of very dry ground conditions that she observed there during July.  How is this best explained - dry weather, warm weather, lack of winter snowfall, or something else?

The first thing to note is that precipitation has not been unusually low this summer; the Colville Village COOP reported 1.81" of precipitation in June and July, compared to a 19-year median of 1.44".  Similarly, the Kuparuk COOP observer measured 1.91" of precipitation compared to a 31-year median of 1.20" for the June-July period.  Nuiqsut airport reported 1.84", their second highest June-July total on record (17-year median of 0.88").


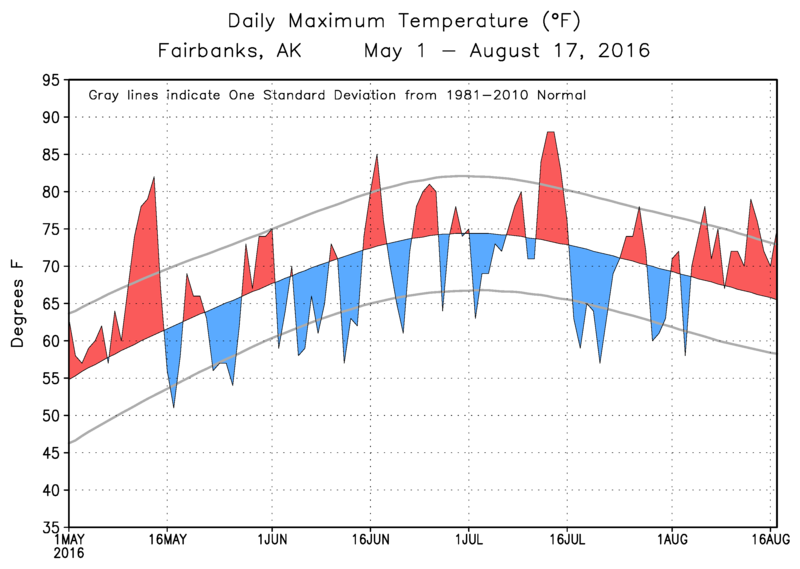
Looking at temperatures, the June-July period was slightly but not dramatically warmer than normal, except for the heat wave in mid-July.  Overall Colville Village was 1.5°F above normal for the two months, and Kuparuk was 1.3°F above normal; three of the last four years were warmer than 2016 over this period at Colville Village.  However, if we look back to May we find very unusual warmth, which contributed to a very early melt-off of the winter snow cover.  Colville Village reported zero snow depth (i.e. no snow over more than 50% of the ground area) on May 14, the earliest date on record (data from 1997-present).  Kuparuk reported melt-off on May 12, also very much earlier than normal (but not a record).  For the rest of May after melt-off, temperatures were persistently above normal in both locations.


The chart below shows that melt-off typically occurred in early June prior to last year at Colville Village (at least since 1997), so this year's early melt added 2-3 weeks of warming and drying of the ground surface in early summer.


At first blush the early melt-off seems to be significant relative to a short summer season: by July 15 this year the area had been snow-free for 9 weeks, compared to around 6 weeks in a normal year.  With evaporation taking place for 50% longer, and with the potential for 24-hour sunshine at this time of year, ground moisture levels might be expected to take a hit relative to normal.  However, temperatures were still low in absolute terms in the second half of May, and it is a cloudy time of year, so total evaporation may have been only slightly enhanced compared to a normal summer.

I was hoping to dig into the detailed evaporation calculation using data from Barrow's CRN site, but unfortunately the NCEI website is not working at present.  In lieu of a full calculation for Barrow, I computed the daily average vapor pressure deficit from Nuiqsut airport, which in any case is much closer to the Colville delta.  The chart below shows the sum of daily average vapor pressure deficit values from the date of melt-off to July 31 in each year since 1999.  Recall that the vapor pressure deficit is directly proportional to the evaporation rate, all else being equal (e.g. wind and solar radiation).  The results indicate that evaporation this year was probably higher than the long-term average but may have been no higher than 2015, and was perhaps lower than 2015.  It's clear that the evaporation is more closely tied to summer temperatures and humidity (and no doubt cloudiness and wind) than to melt-off date, because it's just too cool in May to accomplish much evaporation regardless of whether the ground is snow covered or not.


Looking again at the melt-off chart, another point of interest is that the peak snow depth in winter 2015-2016 was only 9" at Colville Village, which is the lowest in the 20-year history.  It's not a large difference in terms of absolute water content of the snowpack, but the small snow deficit may have contributed to reduced ground moisture levels this summer.  In conclusion, I'd say the dry ground conditions observed by Tracy were caused by a combination of factors, including at least: a slight lack of snowpack last winter, an early melt-off allowing for early warming and drying of the ground, and slightly unusual warmth (and one heat wave) this summer.  It would be interesting to hear others' perspectives; and the faithful climate observers at Colville Village would probably have some useful insight as well.

Here is a parallel melt-off chart for Kuparuk with its longer observing history.  Last winter's snow depth was low there too compared to recent years, although there is a pronounced long-term trend towards rising winter snow depth; this may or may not be real, as it could be related to changing measurement practices or variations in measurement location.


Wednesday, August 10, 2016

Statewide Thaw

The exceptionally persistent and unusual warmth across Alaska in recent months and years (since mid-2013) has been well-publicized on many fronts, and deservedly so.  Here's another angle on the amazing warmth that I haven't seen discussed elsewhere (although perhaps I missed it): it is now very likely that Alaska's statewide 12-month running average temperature will rise above freezing for the first time on record within the next 2 months.  This is according to NOAA's climate division data for Alaska.

We're already very close to the 32°F threshold, as the 12-month average was 31.9°F for periods ending in both April and July of this year.  Last year both August and September were cooler than normal statewide, so if this year continues warm or even normal, it will be easy to bump the 12-month average above freezing.  For example, an August-September mean temperature of 44.65°F would be needed to push the 12-month average up to 32°F, and only 7 out of the past 35 years were cooler than this (most recently last year).

The charts below illustrate the likely range of 12-month running mean temperatures through the end of this year by appending the 1981-2015 distribution of multi-month means to the preceding averages.  Note that anything except continued very unusual warmth will bring the 12-month running average back down below freezing by early winter; it's rather unlikely that the annual mean temperatures will remain above freezing for more than a month or two.  After all, the 1981-2010 normal is 27.2°F, and presumably more normal temperatures will return, at least for a spell, sooner or later.


Monday, August 8, 2016

Radar-Estimated Rainfall

In view of the extraordinary rainfall in the Fairbanks area this summer, I thought it would be interesting to look at radar data to get a better idea of the spatial distribution of the rainfall amounts in June and July.  Using a standard relationship between radar reflectivity and rain rate, I calculated daily rainfall estimates based on data from the Pedro Dome radar site just north of Fairbanks; the figure below shows the June-July estimated totals (click to enlarge).  Observed amounts at surface measuring sites are marked in black.


Here's a comparison of estimated and observed total precipitation by location:

Big Delta AP: 5.97" observed vs 6.22" estimated
Delta 6N COOP: 6.79" vs 6.78"
Nenana AP: 7.39" vs 9.53"
Fairbanks AP: 8.26" vs 6.95"
Eagle Summit SNOTEL: 8.50" vs 6.38"
Clear Sky COOP: 9.30" vs 9.28"
North Pole COOP: 9.77" vs  7.71"
Teuchet Creek SNOTEL: 10.10" vs 11.26"
Ft Knox Mine COOP: 10.94" vs 8.22"
Keystone Ridge COOP: 12.24" vs 8.08"
Mt Ryan SNOTEL: 12.50" vs 10.35"
Monument Creek SNOTEL: 13.30" vs 9.99"
Little Chena Ridge SNOTEL: 14.30" vs 11.92"
Upper Nome Creek SNOTEL: 16.60" vs 11.70"
Munson Ridge SNOTEL: 19.00" vs 18.56"

On average for the 15 stations, the radar algorithm underestimated the total precipitation by 11%, which is not too bad.  In a few spots the radar estimates were excellent, and in a few spots they were notably bad; for example, Keystone Ridge apparently observed 52% more rainfall than the radar indicated.  Localized differences like this might be related to local topographic enhancement or diminution of rainfall compared to what is estimated from radar reflectivity at the height of the radar beam (which increases with distance from the radar site).  It's also possible that the surface measurements are incorrect at some of the observing sites.  The charts below show comparisons of the daily rainfall amounts at Fairbanks airport and Munson Ridge SNOTEL; both of these sites report precipitation for the midnight-to-midnight period, which matches the period that I used for the radar calculations.


Regardless of local discrepancies and potential errors, the main point of the exercise is to get a rough look at the spatial distribution of rainfall during June and July, and the radar estimate serves this purpose quite well.  Based on the SNOTEL data, we already knew there was a broad area of enhanced rainfall in the hills east and northeast of Fairbanks, but the increased rainfall between Fairbanks and Nenana is interesting.  The radar estimate suggests that it was also very wet on the south side of the Tanana valley but north of the higher terrain of the Alaska Range.

Thursday, August 4, 2016

Warm Nights

The temperature dipped below 50°F this morning at Fairbanks airport, which is the first time since June 23.  The 41 consecutive days at or above 50°F is easily a record for Fairbanks; the previous record was 32 days (ending July 26, 1975; July 1975 was the warmest month in Fairbanks history).  Given that the normal low temperature peaks at only 53°F (on about July 6), the absence of any chill in the air during the past 6 weeks is remarkable.

The chart below shows the daily maximum and minimum temperatures since May 1 compared to the 1981-2010 normals.  While daily high temperatures have more often than not been below normal since mid-May, mostly because of all the cloud and rain, low temperatures have been unusually warm.  The average diurnal range so far this summer (since June 1) is only 17.4°F, which is the second lowest on record; only 2014 - which was similarly wet - had a smaller mean diurnal range through this date.


The reduced diurnal range this summer is consistent with the long-term trend, as summer daily low temperatures have experienced 3 times as much warming as summer daily high temperatures in the past 85 years in Fairbanks.  However, the chart below shows that most of the warming in overnight minima seems to have occurred between about 1955 and 1975; this preceded the 1976 PDO shift, so we can't attribute the change to the PDO.  Furthermore, precipitation did not increase concurrently with nighttime temperatures, and in fact the long-term trend in summer precipitation is slightly negative, so increased cloudiness may not be a contributing factor.  A more likely explanation may be population growth and urbanization, which was rapid from the 1950s onward.


It would be interesting to look into these trends a bit more with the help of data from other stations and also with upper-air data from Fairbanks; I'll plan to take this up in a subsequent post.  For now, here's a related post from 3 years ago that I had all but forgotten about until now.

Tuesday, August 2, 2016

July Anomalies

Here's a quick look at the climate anomalies for July across the state.  Nearly all of the long-term observing sites were warmer than normal, and southern areas were far above normal; Anchorage observed their warmest calendar month on record.  Very wet conditions were widespread from Nome to Fairbanks and south to King Salmon and Anchorage.


Here's a nice summary graphic from the NWS (see here for accompanying discussion):

Looking more closely at rainfall in the Fairbanks area, the NWS has this to say:

"July 2016 was a wet month with an incredible 4.97 inches of rain falling at the Fairbanks Airport during the month. This ranked as the 4th wettest of 104 years of record. The July rainfall when combined with the rainfall from June which also happened to be the 4th wettest on record totals 8.26 inches which is the second wettest June to July period on record. The wettest June to July period was the summer of 2014 which accumulated 9.34 inches of rainfall during the same time period. The excessive rainfall over Fairbanks and the surrounding area continues to impact local residents with swift and high flowing rivers and minor flooding of low lying areas. Ground water flooding and ponding of water continues in many areas as we start the month of August. The Moose Creek Dam near North Pole was put into operation again in July. Very heavy rain which totaled 1.98 inches at the airport and 3 to 4 inches in the higher terrain north and east of Fairbanks during the last 4 days of the month pushed many streams and rivers into minor flood stage. Without adding any rainfall for the month of August the summer of 2016 which includes the months of June July and August already ranks as the 10 wettest on record."

Here are some July rainfall totals from the Fairbanks area, compiled by Rick Thoman in characteristically thorough fashion:

Munson Ridge SNOTel: 14.3" (more than any month since early 1980s install)
Upper Nome Creek SNOTel: 11.7"
Stuart Creek RAWS: 11.63"
Little Chena Ridge SNOTel: 9.9"
Angel Creek RAWS: 9.52"
Two Rivers HANDAR: 9.42"
Wickersham Dome HANDAR: 8.97"
Chatanika River RAWS: 8.66"
Caribou Peak RAWS: 8.59"
Keystone Ridge coop: 7.99" (more than 2003 or 2014)
South Fox CoCoRaHS: 6.78"
Eagle Summit SNOTel: 6.4"
Fairbanks 11NE CRN: 5.97" (less than 2014)
Livengood RAWS: 5.46"

It's interesting to note that NOAA's CFSv2 forecast model was successful in anticipating the wet July weather from far in advance; way back in April I discussed the wet CFSv2 forecast for midsummer.  Other seasonal forecast models were on the same page, as shown by April's edition of the North American Multi-Model Ensemble (NMME) forecast for July:

http://www.cpc.ncep.noaa.gov/products/NMME/archive/2016040800/current/usprate_Lead3.html

Looking farther afield at July temperatures across the Arctic basin, extraordinary warmth was observed in high Arctic Canada and northwestern Russia; the map below shows the July mean temperature anomaly in terms of standard deviations.  Three stations (Eureka and Alert, Canada, and Marre-Sale, Russia) saw July temperatures more than 4 SD above normal, and Eureka was the winner at an amazing 5.3 SD above normal.  July was by far the warmest month on record at Eureka, with a mean temperature of 12.0°C; the previous record was 9.6°C, observed just last year in July.  Prior to 2003, no calendar month had ever exceeded 7.5°C in Eureka (data back to 1947).