A few weeks ago I commented on the decrease in "snow ratio" of the last decade or so in Fairbanks. Although winter precipitation obviously still falls as snow the vast majority of the time, the recurrent warmth of recent years has produced a lower ratio of snow depth to liquid-equivalent precipitation, and the occasional winter rain events (a few of them very large) have contributed significantly to this trend.
One would expect similar or larger trends to be found at western Alaska sites, where the proximity of the Bering Sea has produced excessive warmth in recent years: other than the North Slope, the west coast and Aleutians have seen the most significant winter warming of anywhere in Alaska in the past few decades.
But interestingly the results are mixed when looking at Bethel and Nome. [Note that "snow depth" in the charts and discussion refers to the accumulation of
daily snow amounts - the "total snowfall" - and not the actual depth of
snow on the ground at any one time. The latter is affected by compaction, evaporation, melting, blowing away, etc.]


Sadly snow measurements ended at most Alaska climate sites a few years ago, so the data isn't up-to-date, but I'm not sure there is much to glean from these two sites. Bethel had several low-ratio winters after 2010, but the historical record looks a bit unrealistic, with clusters of high and low ratio winters that do not look as randomly distributed as we would expect.
As for Nome, the upward trend is quite striking, but I'm skeptical, given what we know about the dramatic warming in recent years. It seems possible that snow depth may have been systematically lower in early decades, perhaps because of less shelter from buildings near the observing site, or perhaps because of different measuring practices.
We can look at the ERA5 reanalysis data for an alternative view of changes in the proportion of snow versus rain. My last post showed that the model shows a change in Fairbanks since 2010-11, which agrees with the ground-truth observations. On a statewide basis, the fraction of winter precipitation falling as snow has also dropped, with an increasing number of years with percentages in the low 90s, and fewer years (but still some) with nearly all precipitation falling as snow.

Note that the data prior to 1950 is a newly-released component of ERA5, and I included it "just because I can". It's highly uncertain and probably not worth much at all.
On an annual basis the fraction of precipitation falling as snow has dropped off quite a bit since the 1970s, according to ERA5, with 1992 being the last year with more than half falling as snow (and that certainly was a very unusual year).

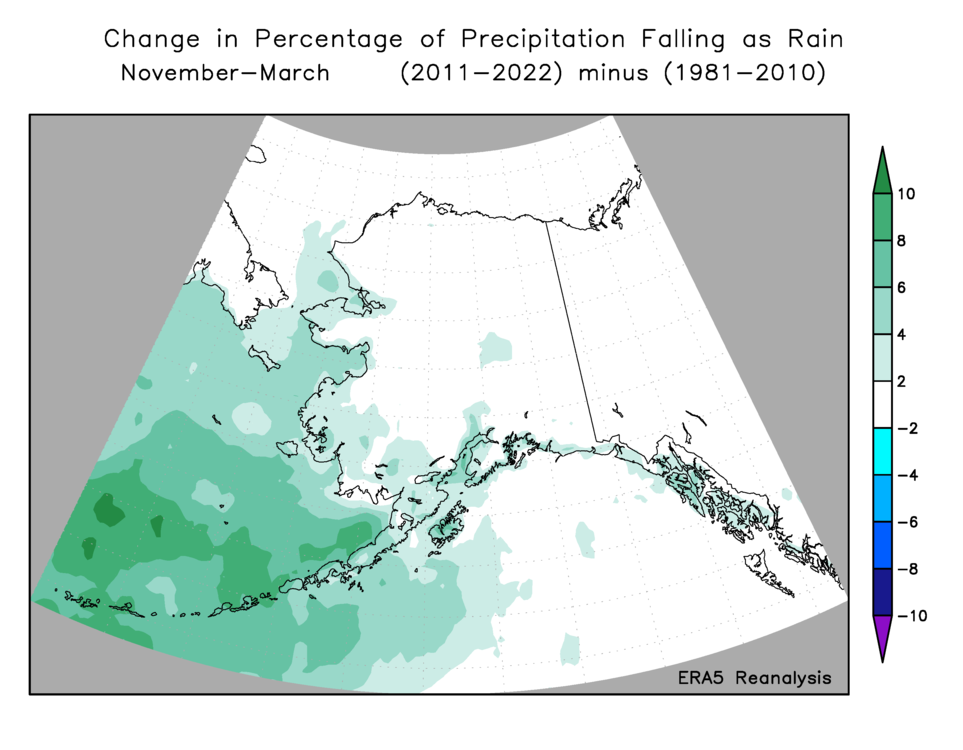
Here's a map of the total fraction of November-March precipitation falling as rain in the last 12 years (this makes for a more pleasing map than the inverse fraction):

The change from the prior 3 decades is heavily concentrated over the Bering Sea, where the increase in the percentage has been as much as 10% (e.g. a change from 50% to 60%).
The increase over land is much smaller in absolute terms, but of course it is large in relative terms. Here's the percentage change, but only for locations with at least 0.1% rain fraction in the 1981-2010 period.

Looking farther afield, it's interesting to see that the largest changes, in absolute terms, have been across eastern Europe, the Norwegian Sea, and eastern mid-latitude China. These are places where both rain and snow are common in winter, and the relative fraction varies a lot from year to year and decade to decade. The tendency for a positive Arctic Oscillation in recent years has certainly produced warm winters in much of Europe and Asia.

The charts below illustrate the year-to-year changes for all land area north of 60°N. It's interesting to see the annual fraction of snow apparently peak in the 1970s, consistent with a cool phase of the Atlantic Ocean.


Purely from personal observation and conversations with locals over the last 20 years, Nome has been inundated with snow in many recent winters. The warming they've experienced has pushed temperatures up into a prime snow-producing range but rarely beyond it. An increase in southerly flow and general storminess would equate with an increase in overall precipitation also, but it seems like they've been getting hammered with blizzard conditions and drifting regularly.
ReplyDeleteThat's a very interesting perspective, Andy - thanks. It's certainly fair to say that under the right circumstances, a warming trend could deliver a lot more snow, along with greater total precipitation. More investigation needed.
DeleteRichard, thanks for the post.
ReplyDeleteI want to make sure I'm clear on how you are defining/calculating the snow ratio in the 1st two graphs and elsewhere. I'm thinking for each year (Nov-Mar in this case) you are adding up all the reported snowfall and dividing by the total precipitation reported. But on the top title of the graphs and in the text you say "snow depth" which in the observing community is a measure of snow on the ground at a certain time, affected by compaction, melting etc.
Hi Jim, good question, and I admit that was confusing.
DeleteWhen it comes to the ground-truth climate observations (Nome, Bethel, Fairbanks), I'm exclusively talking about total snowfall, not the instantaneous snow depth. I labeled the graphs as "accumulated snow depth" to distinguish from the accumulation of liquid-equivalent snowfall, which is what you get from models like ERA5.
The "accumulation" of different snow variables does get a bit tricky.
Another powerful blizzard in Kotzebue on Saturday!
Thanks for the clarification.
DeleteYou did note that variations in snow measuring locations and practices can throw off any analysis of this kind, and I'd like to say from my experience you'd be hard pressed to overestimate the magnitude of this problem. Especially in the windy areas.
Kotzebue: quite the blizzard. Hours of wind gusts 50-60 mph yet no mention of blowing snow from the ASOS. I think the unusually high RH (probably due to either the temp being a little low or the dew point a little high or both) tricked into thinking it had dense fog, so it didn't bother with reporting blowing snow.
I hope nobody 20 years from now tries to study the sharp decline in blowing snow in NW AK.
Yes, I think this is a tough problem for station data because of all the issues mentioned. At windy sites I've noticed an abnormally large amount of perfect 10:1 snow:liquid ratios (or other whole numbers). My suspicion is that during wind events the liquid was measured, but snowfall was calculated after-the-fact based on this "standard" ratio. Check out Kotzebue winter 2018-2019 as an example.
ReplyDeleteGreat comment, Ken. It's certainly a huge problem with the data, and relatively easy to diagnose... in fact it's amusing to see the number of days with a 10:1 ratio jump up and down, obviously depending on who was doing the "measurement". But frankly I wouldn't have a lot of confidence in the liquid-equivalent precipitation numbers either; it's just tremendously difficult to make good winter precip measurements at windy sites.
DeleteWould it be too strong to say that despite having more data than ever, the quality and availability seems to be getting worse (especially for precipitation and snowfall)? For Kotzebue I did a quick look at several of their blizzards earlier in the month. For the 1st-2nd (near blizzard) the ASOS seems to have reported only .05 inches of precip. Now I realize up there a blizzard can occur just from blowing snow with no actual snowfall but winds were not that severe for that time period. For the big one around the 4-6th perhaps 0.80" reported, but there was an outage, and I didn't do an indepth examination. Most recent one on 25-26th around 1.57 inches looking at the obs, but shown as M on xmACIS.
DeleteIn my own area we had a big snow dump on March 1-2, dry snow, moderate W wind (nothing like Kotzebue). At Haines#2 I measured 29.1 inches of snowfall containing 2.22" precip. The ASOS, less than 2 miles away, despite reporting moderate or heavy snow for many hours only could come up with a trace of precip for the whole storm. I saw one report that calling the precip missing, but now it seems to be accepted (on xmACIS anyway). On the 15-16th another warmer (snow eventually turning to rain) event and the airport came in with 2.06 vs 3.29 for the coop, much more believable, but since I've been tracking this issue I'm still skeptical.
For availability issues, see this story: http://www.nomenugget.com/news/recent-storms-highlight-weather-station-reporting-woes
It's real shame, Jim, to see the quality and availability of weather and climate data deteriorate so badly. I confirmed that GHCN-D (the primary source for xmACIS) has missing precip for the latest blizzard in Kotzebue, and indeed Haines AP has only a trace for March 1-2. That's crazy.
DeleteI suspect that the ASOS instruments are no worse than before, but there is no longer any manual correction/augmentation of the climate data, and as noted in the Nome story, communication seems to be a problem.
I can't help wondering if it might be possible to start a citizen-led effort to reinstate some of the daily climate observations. Measurements could be made "off duty" by interested FAA employees around the state, perhaps with a very modest bit of funding to make it worth their time. Reports submitted via CoCoRAHS. If a few key people would be willing to co-author a proposal, it might get somewhere for funding. Food for thought...