Most of interior Alaska is now approaching the date at which the climatological average temperature drops most rapidly. At most interior stations, the peak rate of climatological cooling is about 5-7 °F per week, or up to 1 °F per day. The map below shows the maximum weekly rate of cooling at each station included in the 1981-2010 daily normals from NCDC. Based on this data, the COOP station in Woodsmoke has the distinction of the most rapid cooling of any station, at 7.1 °F per week between October 15 and 27. Woodsmoke is the only station with a weekly cooling of 7 °F or more. The Aleutian town of Adak, with its extremely maritime climate, has the least rapid peak cooling.
The second map, below, shows the spatial distribution of the date of most rapid cooling; the colors indicate the starting date of the week with peak cooling. It's interesting to note that in general, the date of most rapid cooling progresses eastward across the state, with most western stations seeing the most rapid seasonal change in early October, while the southeastern interior sees peak cooling in the second half of the month. I expected to see the peak cooling occur later in the year along the west coast, because of the maritime influence, but in fact it's the other way around: in the more continental locations, there is nothing to keep the temperature from accelerating downward as the sun's strength diminishes. At least, that's how I interpret the data.
As a point of comparison, it's fun to note that Oymyakon, the notorious pole of cold in Siberia, sees its average temperature drop by 9.4 °F in the week beginning October 18. The average daily mean drops from 24.6 °F on October 1 to -15.3 °F on November 1... 40 degrees in one month. Alaska's top competitor in the same period is, again, Woodsmoke, with a drop of 28.1 °F.
Objective Comments and Analysis - All Science, No Politics
Primary Author Richard James
2010-2013 Author Rick Thoman
Monday, October 7, 2013
Saturday, October 5, 2013
Running Precipitation Total
Fairbanks has been on a precipitation roller coaster ride the last few months. It's been either feast or famine. It has seemed to me that Fairbanks is always running a deficit for precipitation whenever I looked at the daily or monthly climate summary. As it turns out, when looking at a 30-day running average of precipitation, Fairbanks has been in a deficit 59% of the time since January 1st, 2011, and in a surplus 41% of the time. Amazingly, Anchorage has been just the opposite. Since January 1st, 2011, Anchorage's 30-day precipitation total has been in a surplus 64% of the time and in a defect only 36% of the time. Quite a difference.
The chart below shows the 30-day precipitation surplus or deficit for both Anchorage and Fairbanks over the aforementioned time period.
Thursday, October 3, 2013
First Snow Date
Most areas of Northern and Interior Alaska have already received their first measurable snowfall this season. Even the Anchorage Bowl (except the official climate site) had a rare early season snowfall late last month. Looking back through the historical record, I decided to put together a map of average (not 'normal') first measurable snow dates.
For this analysis, a station had to have 15 complete years of snowfall data (July 1 to June 30). The 15 years were not required to be consecutive nor contemporary. It took several iterations of analysis to pin down a methodology that filtered out years with too much missing data. Even still, there are still many instances where data were not entered into the GHCN database properly. Still, the calculated data for most stations appears pretty reasonable. The map shows the results of the interpolation from the 189 stations used in the analysis. A 6-point inverse distance weighted surfacing technique was utilized to smooth out the data for the map. Below the map, is a table of all the dates (unsmoothed). To deal with leap years, I calculated the number of days after June 30th that the first measurable snowfall occurred. The table contains the average of those Julian dates and a conversion to calendar dates. For reference, September 1st is day #63, October 1st is day #93, and November 1st is day #124. (Hopefully the length of the table isn't too distracting. If it is, I will change it.
| Elevation (m) | Station Name | Days after June 30th For First Measurable Snow | Date | Num of Years |
| 5.2 | ADAK | 124.2 | 1-Nov | 50 |
| 82.9 | ALYESKA | 119.1 | 27-Oct | 32 |
| 39.9 | ANCHORAGE FRCST OFC | 113.1 | 21-Oct | 15 |
| 36.6 | ANCHORAGE INTL AP | 108.8 | 16-Oct | 60 |
| 42.1 | ANCHORAGE MERRILL FLD | 119.2 | 27-Oct | 41 |
| 139.6 | ANDERSON LAKE | 110.0 | 17-Oct | 27 |
| 8.5 | ANGOON PWR | 136.2 | 13-Nov | 30 |
| 26.2 | ANIAK AP | 102.0 | 10-Oct | 31 |
| 33.2 | ANNETTE ISLAND AP | 145.5 | 22-Nov | 71 |
| 28 | ANNEX CREEK | 122.1 | 30-Oct | 66 |
| 21.3 | ATTU | 132.7 | 9-Nov | 15 |
| 13.4 | AUKE BAY | 127.9 | 4-Nov | 47 |
| 6.1 | BARANOF | 130.8 | 7-Nov | 22 |
| 9.4 | BARROW POST ROGERS AP | 42.5 | 11-Aug | 85 |
| 11.9 | BARTER ISLAND WSO AP | 46.1 | 15-Aug | 40 |
| 10.7 | BEAVER FALLS | 149.1 | 26-Nov | 40 |
| 3 | BELL ISLAND | 135.2 | 12-Nov | 19 |
| 38.7 | BENS FARM | 126.7 | 3-Nov | 26 |
| 31.1 | BETHEL AP | 102.1 | 10-Oct | 84 |
| 195.7 | BETTLES AP | 90.2 | 28-Sep | 62 |
| 389.2 | BIG DELTA AP | 92.1 | 30-Sep | 57 |
| 18.3 | BIG RIVER LAKES | 116.2 | 24-Oct | 19 |
| 6.1 | CALDER | 142.7 | 19-Nov | 19 |
| 25.9 | CANNERY CREEK | 123.5 | 31-Oct | 26 |
| 649.8 | CANTWELL 2 E | 88.5 | 26-Sep | 24 |
| 14.9 | CAPE DECISION | 182.9 | 29-Dec | 15 |
| 56.4 | CAPE HINCHINBROOK | 128.4 | 5-Nov | 20 |
| 13.7 | CAPE LISBURNE | 61.9 | 30-Aug | 20 |
| 15.8 | CAPE LISBURNE AFS | 87.4 | 25-Sep | 17 |
| 144.8 | CAPE NEWENHAM | 100.3 | 8-Oct | 26 |
| 71.9 | CAPE NEWENHAM AFS | 103.1 | 11-Oct | 16 |
| 132.3 | CAPE ROMANZOF | 93.3 | 1-Oct | 24 |
| 53.9 | CAPE SARICHEF LT STN | 131.2 | 8-Nov | 19 |
| 27.1 | CAPE SPENCER | 158.6 | 5-Dec | 15 |
| 14.9 | CAPE ST ELIAS | 146.3 | 23-Nov | 24 |
| 280.4 | CENTRAL #2b | 104.9 | 12-Oct | 29 |
| 577.6 | CHANDALAR LAKE | 94.6 | 2-Oct | 16 |
| 548.6 | CHICKEN | 95.2 | 3-Oct | 15 |
| 196 | CHITINA | 109.6 | 17-Oct | 15 |
| 412.7 | CHULITNA RIVER | 97.6 | 5-Oct | 33 |
| 182.3 | CIRCLE CITY | 103.3 | 11-Oct | 19 |
| 262.1 | CIRCLE HOT SPRINGS | 91.2 | 29-Sep | 40 |
| 150.9 | CLEAR 4 N | 98.2 | 6-Oct | 19 |
| 335.3 | CLEARWATER | 97.0 | 5-Oct | 19 |
| 23.8 | COLD BAY AP | 110.6 | 18-Oct | 62 |
| 298.1 | COLLEGE 5 NW | 94.7 | 2-Oct | 34 |
| 182 | COLLEGE OBSY | 95.4 | 3-Oct | 62 |
| 1.5 | COLVILLE VILLAGE | 72.7 | 10-Sep | 16 |
| 153.9 | COOPER LAKE PROJECT | 122.7 | 30-Oct | 40 |
| 114.3 | COOPER LANDING 5 W | 122.6 | 30-Oct | 30 |
| 304.8 | COPPER CTR | 110.5 | 18-Oct | 16 |
| 9.4 | CORDOVA M K SMITH AP | 125.7 | 2-Nov | 85 |
| 7.6 | CORDOVA NORTH | 127.2 | 4-Nov | 22 |
| 13.1 | CRAIG | 159.5 | 6-Dec | 22 |
| 26.2 | DILLINGHAM FAA AP | 119.9 | 27-Oct | 44 |
| 3 | DUTCH HARBORb | 136.9 | 13-Nov | 44 |
| 259.1 | EAGLE | 100.2 | 8-Oct | 39 |
| 151.8 | EAGLE RIVER 5 SE | 117.2 | 25-Oct | 19 |
| 166.7 | EIELSON FLD | 92.9 | 30-Sep | 47 |
| 173.1 | EIELSON FLDb | 93.4 | 1-Oct | 21 |
| 11.6 | EKLUTNA PROJECT | 110.1 | 18-Oct | 31 |
| 15.8 | ELDRED ROCK | 135.6 | 12-Nov | 22 |
| 6.1 | ELFIN COVE | 131.7 | 8-Nov | 32 |
| 58.5 | ELMENDORF AFB | 105.2 | 13-Oct | 36 |
| 131.7 | FAIRBANKS INTL AP | 92.6 | 30-Sep | 65 |
| 458.1 | FAREWELL FAA AP | 90.8 | 28-Sep | 27 |
| 9.1 | FIVE FINGER LT STN | 165.3 | 12-Dec | 23 |
| 99.1 | FLAT | 106.9 | 14-Oct | 22 |
| 39.9 | FORTMANN HATCHERY | 132.2 | 9-Nov | 18 |
| 143.3 | FT RICHARDSON WTP | 121.4 | 29-Oct | 16 |
| 132 | FT YUKON | 95.9 | 3-Oct | 43 |
| 46.6 | GALENA AP | 95.5 | 3-Oct | 17 |
| 288 | GILMORE CREEK | 97.7 | 5-Oct | 23 |
| 13.7 | GLACIER BAY | 136.4 | 13-Nov | 29 |
| 671.2 | GLEN ALPS | 100.2 | 8-Oct | 33 |
| 421.5 | GLENNALLEN KCAM | 105.2 | 13-Oct | 28 |
| 6.1 | GUARD ISLAND LIGHT STN | 155.8 | 2-Dec | 16 |
| 476.1 | GULKANA AP | 96.5 | 4-Oct | 57 |
| 12.2 | GUSTAVUS | 131.0 | 8-Nov | 44 |
| 249.9 | HAINES 40 NW | 109.3 | 17-Oct | 23 |
| 4.6 | HAINES AP | 126.9 | 3-Nov | 28 |
| 53.3 | HAINES TERMINAL | 150.9 | 27-Nov | 22 |
| 304.8 | HAYES RIVER | 100.6 | 8-Oct | 16 |
| 448.1 | HEALY 2 NW | 96.2 | 4-Oct | 25 |
| 6.1 | HOLY CROSS | 107.4 | 15-Oct | 54 |
| 345 | HOMER 5 NW | 107.4 | 15-Oct | 21 |
| 329.2 | HOMER 8 NW | 107.0 | 15-Oct | 32 |
| 156.1 | HOMER 9 E | 113.8 | 21-Oct | 21 |
| 19.5 | HOMER AP | 119.6 | 27-Oct | 61 |
| 39.6 | HOONAH | 140.4 | 17-Nov | 20 |
| 54.9 | HOPE | 126.5 | 3-Nov | 19 |
| 43.6 | ILIAMNA AP | 117.8 | 25-Oct | 49 |
| 388.9 | INDIAN MTN AFS | 90.7 | 28-Sep | 16 |
| 36.6 | INTRICATE BAY | 116.2 | 24-Oct | 40 |
| 52.1 | JUNEAU DWTN | 151.5 | 28-Nov | 30 |
| 15.2 | JUNEAU DWTN(b) | 142.3 | 19-Nov | 28 |
| 4.9 | JUNEAU INTL AP | 127.7 | 4-Nov | 64 |
| 21.3 | KAKE | 170.1 | 17-Dec | 19 |
| 21.3 | KASILOF 3 NW | 118.4 | 26-Oct | 48 |
| 38.4 | KENAI 9N | 115.2 | 23-Oct | 16 |
| 27.7 | KENAI MUNI AP | 115.3 | 23-Oct | 62 |
| 673.9 | KENNECOTT | 101.1 | 9-Oct | 28 |
| 23.2 | KETCHIKAN INTL AP | 156.5 | 3-Dec | 51 |
| 487.7 | KEYSTONE RIDGE | 86.8 | 24-Sep | 16 |
| 19.2 | KING SALMON | 112.9 | 20-Oct | 77 |
| 18.3 | KITOI BAY | 135.8 | 12-Nov | 41 |
| 46 | KODIAK | 130.1 | 7-Nov | 29 |
| 24.4 | KODIAK AP | 126.6 | 3-Nov | 64 |
| 9.1 | KOTZEBUE RALPH WEIN AP | 97.3 | 5-Oct | 72 |
| 19.5 | KUPARUK | 71.9 | 9-Sep | 25 |
| 14.9 | LATOUCHE | 135.7 | 12-Nov | 25 |
| 223.4 | LAZY MTN | 107.8 | 15-Oct | 23 |
| 4.3 | LITTLE PORT WALTER | 144.4 | 21-Nov | 60 |
| 17.4 | MAIN BAY | 119.9 | 27-Oct | 23 |
| 82.9 | MANLEY HOT SPRINGS | 101.2 | 9-Oct | 45 |
| 52.4 | MATANUSKA EXPERIMENT FARM | 116.7 | 24-Oct | 86 |
| 381 | MCCARTHY 3 SW | 96.0 | 4-Oct | 19 |
| 101.5 | MCGRATH AP | 95.7 | 3-Oct | 73 |
| 630.9 | MCKINLEY PARK | 91.8 | 29-Sep | 76 |
| 14 | MIDDLETON ISLAND AUTO | 141.9 | 18-Nov | 15 |
| 312.4 | MINCHUMINA | 96.1 | 4-Oct | 39 |
| 150 | MOOSE PASS 3 NW | 124.5 | 1-Nov | 22 |
| 6.1 | MOSES POINT FAA AP | 97.8 | 5-Oct | 20 |
| 890 | NABESNA | 94.0 | 2-Oct | 25 |
| 109.7 | NENANA MUNI AP | 102.9 | 10-Oct | 54 |
| 4 | NOME MUNI AP | 101.4 | 9-Oct | 86 |
| 144.8 | NORTH POLE | 94.9 | 2-Oct | 41 |
| 9.1 | NORTHEAST CAPE | 94.9 | 2-Oct | 15 |
| 522.1 | NORTHWAY AP | 89.5 | 27-Sep | 57 |
| 34.1 | NULATO | 101.9 | 9-Oct | 16 |
| 402.3 | OLD EDGERTON | 98.8 | 6-Oct | 22 |
| 67.1 | PALMER 1 N | 109.7 | 17-Oct | 16 |
| 65.8 | PALMER JOB CORPS | 117.8 | 25-Oct | 45 |
| 823 | PAXSON(b) | 84.3 | 22-Sep | 16 |
| 3.7 | PELICAN | 130.6 | 7-Nov | 24 |
| 32.6 | PETERSBURG 1 | 135.3 | 12-Nov | 62 |
| 20.4 | PLANT MATERIALS CTR | 116.9 | 24-Oct | 16 |
| 6.1 | PLATINUM | 120.4/td> | 28-Oct | 15 |
| 6.1 | POINT RETREAT LT STN | 143.5 | 20-Nov | 22 |
| 3.7 | PORT ALEXANDER | 145.3 | 22-Nov | 40 |
| 79.2 | PORT ALSWORTH | 118.3 | 26-Oct | 43 |
| 28 | PORT HEIDEN | 128.8 | 5-Nov | 21 |
| 12.2 | PORT SAN JUAN | 132.3 | 9-Nov | 25 |
| 566.3 | PUNTILLA | 104.8 | 12-Oct | 40 |
| 116.1 | RAMPART | 95.7 | 3-Oct | 27 |
| 157.9 | SEWARD 19N | 117.9 | 25-Oct | 22 |
| 129.2 | SEWARD 8 NW | 107.2 | 15-Oct | 17 |
| 6.7 | SEWARD AP | 131.8 | 8-Nov | 88 |
| 694.9 | SHEEP MTN CAA AP | 99.7 | 7-Oct | 20 |
| 37.2 | SHEMYA USAF BASE | 124.2 | 1-Nov | 39 |
| 3 | SHISHMAREF | 98.6 | 6-Oct | 17 |
| 4.3 | SITKA AIRPORT | 144.6 | 21-Nov | 48 |
| 20.4 | SITKA MAGNETIC OBSY | 144.4 | 21-Nov | 71 |
| 10.7 | SKAGWAY | 136.4 | 13-Nov | 39 |
| 45.7 | SKWENTNA | 108.0 | 15-Oct | 46 |
| 668.1 | SLANA | 105.9 | 13-Oct | 34 |
| 704.7 | SNOWSHOE LAKE | 92.9 | 30-Sep | 35 |
| 597.4 | SOURDOUGH 1 N | 94.9 | 2-Oct | 19 |
| 481.6 | SPARREVOHN | 87.8 | 25-Sep | 21 |
| 484 | SPARREVOHN MTN AFS | 101.3 | 9-Oct | 16 |
| 10.7 | ST PAUL ISLAND AP | 106.9 | 14-Oct | 63 |
| 734.9 | SUMMIT WSO AP | 83.6 | 21-Sep | 34 |
| 167.6 | SUTTON 1 W | 105.3 | 13-Oct | 29 |
| 798.6 | TAHNETA PASS | 91.9 | 29-Sep | 17 |
| 106.7 | TALKEETNA AP | 109.9 | 17-Oct | 76 |
| 469.7 | TANACROSS | 91.8 | 29-Sep | 18 |
| 69.2 | TANANA CALHOUN MEM AP | 100.9 | 8-Oct | 82 |
| 293.8 | TATALINA | 99.2 | 7-Oct | 27 |
| 82 | TIN CITY | 81.6 | 19-Sep | 28 |
| 495.3 | TOK | 95.4 | 3-Oct | 36 |
| 481.3 | TONSINA | 107.0 | 15-Oct | 35 |
| 11 | TREE POINT LT STN | 159.7 | 6-Dec | 29 |
| 99.1 | TRI NAL ACRES | 116.7 | 24-Oct | 16 |
| 734.9 | TRIMS CAMP | 85.5 | 23-Sep | 20 |
| 81.1 | UMIAT | 88.4 | 26-Sep | 28 |
| 5.5 | UNALAKLEET FLD | 101.3 | 9-Oct | 48 |
| 144.8 | UNIVERSITY EXP STN | 103.5 | 11-Oct | 101 |
| 29 | VALDEZ WSO | 109.6 | 17-Oct | 82 |
| 7.6 | WALES | 96.6 | 4-Oct | 46 |
| 152.4 | WASILLA 2 NE | 104.2 | 12-Oct | 15 |
| 15.2 | WASILLA 3 S | 120.5 | 28-Oct | 38 |
| 82.3 | WHITES CROSSING | 118.6 | 26-Oct | 31 |
| 307.8 | WHITESTONE FARMS | 91.8 | 29-Sep | 16 |
| 18.3 | WHITTIER | 118.6 | 26-Oct | 40 |
| 62.5 | WILLOW WEST | 119.9 | 27-Oct | 17 |
| 349.6 | WISEMAN | 94.1 | 2-Oct | 29 |
| 17.1 | WRANGELL AIRPORT | 149.8 | 26-Nov | 70 |
| 8.2 | YAKATAGA AP | 129.1 | 6-Nov | 24 |
| 10.1 | YAKUTAT STATE AP | 122.3 | 30-Oct | 86 |
Wednesday, October 2, 2013
The PDO in Early Winter
As we move from autumn towards winter in interior Alaska, the phase of the Pacific Decadal Oscillation (PDO) will become a more important influence on the prevailing climate anomalies. The PDO phase is quite highly correlated with average temperatures from about November through March in interior Alaska, while September is the month with the weakest connection. The chart below shows that the PDO was negative for most of this summer, returned to near-neutral in early September, and has become more negative again in recent days. Longer term, the PDO has been predominantly negative since late 2007, after being generally positive from 1976 to 1997.
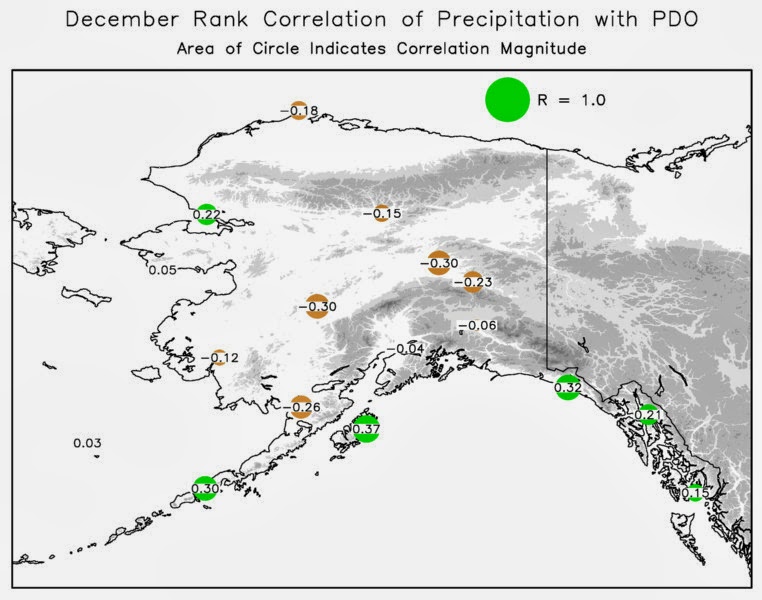
Much has been written about the influence of the PDO on Alaska climate, but to illustrate the effects here I looked at monthly data for 17 stations from 1950 to 2010. The maps below show the rank correlation of the monthly PDO index with temperature and precipitation for October through December; note that you should be able to click on the maps individually to bring up full-size versions. I've used the Spearman rank correlation coefficient rather than the Pearson correlation coefficient, because the Pearson correlation can be badly swayed by outliers and is inappropriate for precipitation, which has a non-Gaussian distribution.
A few points stand out from the maps:
The interesting behavior for the interior prompted me to look at the correlation between temperature and precipitation. I had assumed that the correlation would be positive throughout Alaska in winter, but this is not the case: the map below shows that for the October through December averages, temperature is slightly inversely correlated with precipitation at Fairbanks and Big Delta; in other words, warm Oct-Dec seasons tend to be drier than average, while cold is more associated with wet. Presumably this has to do with the frequency of a chinook pattern, which is both warm and dry. Elsewhere in Alaska, wetter Oct-Dec seasons are generally warmer, as expected.
In conclusion: if the PDO phase stays significantly negative through the early winter, then the chance of below-average temperatures will be boosted. Do we know if the PDO will remain in the negative phase? No, we don't; but in past years with a significantly negative phase in July and August, the PDO almost always remained negative through the subsequent winter months, and so a negative phase this winter appears to be a good bet. Note that this idea of a cold early winter is at odds with the analog indication from early snow, which of course means that more research is required!
One last thing to point out is that the influence of the PDO is far from linear even for temperature; the climate frequency distribution changes in interesting ways as the PDO oscillates. Rick has done some work on this, here for example:
http://weather.arsc.edu/Events/LAWS08/Presentations/Thoman.pdf
A few points stand out from the maps:
- The positive correlation with temperature is universal across Alaska, as expected, is stronger in the south as expected, and stronger in November and December than in October (except in the southwest). Thus a negative PDO phase tended to be associated with colder temperatures in 1950-2010, and a positive phase with warmer.
- The correlations with precipitation are much smaller but are consistently positive along the south coast in November and December - i.e. a negative PDO favors drier conditions there. Interestingly, the correlations become negative throughout the interior in December, i.e. a negative PDO is (weakly) associated with wetter conditions. I did not expect to see this, though perhaps it is common knowledge to some.
| October |
|
|
| November |
|
|
| December |
|
|
In conclusion: if the PDO phase stays significantly negative through the early winter, then the chance of below-average temperatures will be boosted. Do we know if the PDO will remain in the negative phase? No, we don't; but in past years with a significantly negative phase in July and August, the PDO almost always remained negative through the subsequent winter months, and so a negative phase this winter appears to be a good bet. Note that this idea of a cold early winter is at odds with the analog indication from early snow, which of course means that more research is required!
One last thing to point out is that the influence of the PDO is far from linear even for temperature; the climate frequency distribution changes in interesting ways as the PDO oscillates. Rick has done some work on this, here for example:
http://weather.arsc.edu/Events/LAWS08/Presentations/Thoman.pdf
Subscribe to:
Posts (Atom)