As we move from autumn towards winter in interior Alaska, the phase of the Pacific Decadal Oscillation (PDO) will become a more important influence on the prevailing climate anomalies. The PDO phase is quite highly correlated with average temperatures from about November through March in interior Alaska, while September is the month with the weakest connection. The chart below shows that the PDO was negative for most of this summer, returned to near-neutral in early September, and has become more negative again in recent days. Longer term, the PDO has been predominantly negative since late 2007, after being generally positive from 1976 to 1997.

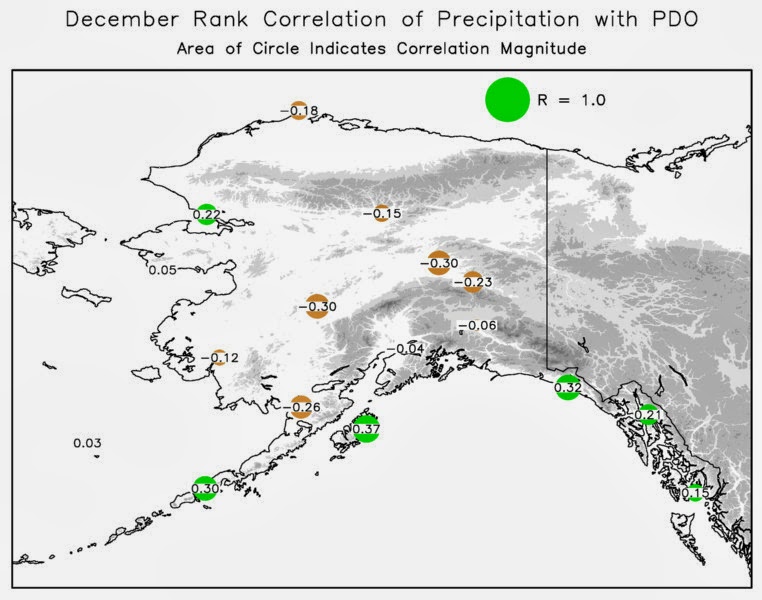
Much has been written about the influence of the PDO on Alaska climate, but to illustrate the effects here I looked at monthly data for 17 stations from 1950 to 2010. The maps below show the rank correlation of the monthly PDO index with temperature and precipitation for October through December; note that you should be able to click on the maps individually to bring up full-size versions. I've used the Spearman rank correlation coefficient rather than the Pearson correlation coefficient, because the Pearson correlation can be badly swayed by outliers and is inappropriate for precipitation, which has a non-Gaussian distribution.
A few points stand out from the maps:
- The positive correlation with temperature is universal across Alaska, as expected, is stronger in the south as expected, and stronger in November and December than in October (except in the southwest). Thus a negative PDO phase tended to be associated with colder temperatures in 1950-2010, and a positive phase with warmer.
- The correlations with precipitation are much smaller but are consistently positive along the south coast in November and December - i.e. a negative PDO favors drier conditions there. Interestingly, the correlations become negative throughout the interior in December, i.e. a negative PDO is (weakly) associated with wetter conditions. I did not expect to see this, though perhaps it is common knowledge to some.
| October |
|
|
| November |
|
|
| December |
|
|
The interesting behavior for the interior prompted me to look at the correlation between temperature and precipitation. I had assumed that the correlation would be positive throughout Alaska in winter, but this is not the case: the map below shows that for the October through December averages, temperature is slightly inversely correlated with precipitation at Fairbanks and Big Delta; in other words, warm Oct-Dec seasons tend to be drier than average, while cold is more associated with wet. Presumably this has to do with the frequency of a chinook pattern, which is both warm and dry. Elsewhere in Alaska, wetter Oct-Dec seasons are generally warmer, as expected.

In conclusion: if the PDO phase stays significantly negative through the early winter, then the chance of below-average temperatures will be boosted. Do we know if the PDO will remain in the negative phase? No, we don't; but in past years with a significantly negative phase in July and August, the PDO almost always remained negative through the subsequent winter months, and so a negative phase this winter appears to be a good bet. Note that this idea of a cold early winter is at odds with the
analog indication from early snow, which of course means that more research is required!
One last thing to point out is that the influence of the PDO is far from linear even for temperature; the climate frequency distribution changes in interesting ways as the PDO oscillates. Rick has done some work on this, here for example:
http://weather.arsc.edu/Events/LAWS08/Presentations/Thoman.pdf


Great analysis Richard. I am curious about lag times. For example, might a low PDO index in November correlate to a below normal December?
ReplyDeleteBrian,
DeleteThanks. There is certainly a modest correlation at a lag time of 1 month or even greater, because the PDO tends to evolve rather slowly. For example, in Fairbanks the correlation with December temperature at various lag (lead) times is:
0-month: 0.52
1-month: 0.27
2-month:0.27
3-month: 0.24
Interestingly the lagged correlation is better for predicting November temperature from October or before:
0-month: 0.54
1-month: 0.42
2-month: 0.26
3-month: 0.30
Here's the result for predicting November in Anchorage:
0-month: 0.59
1-month: 0.48
2-month: 0.27
3-month: 0.34
Agreed, great analysis Richard.
DeleteLooks like your using something besides the JISAO PDO index? I've been watching SST anomalies in the North Pacific, which over the summer had a decided non-canonical pattern in spite of the large negative PDO values (which must have been coming from the positive anomalies in the central North Pacific). In the past few weeks the positive anomalies have collapsed in the Gulf of Alaska, and the Pacific-wide anomalies are looking much more canonical.
We calculate the daily PDO values at work using the daily SST analyses, but I do rely on the JISAO index for monthly data. Our values match the JISAO values quite well as we are using the same method. For the correlations here I used the JISAO values.
DeleteI agree it has been an interesting summer for the PDO. The central Pacific EOF loading stretches all the way from Japan to 150W along about 40N, so as long as the SSTs are positive in that area, the PDO can remain negative. But like you, I don't recognize the pattern visually unless that horseshoe of cold shows up along the North American coast.