One of the most striking and memorable global climate stories of 2020 was the remarkable and persistent extreme warmth that occurred in Arctic Russia. The sheer magnitude of the anomaly for the annual mean temperature in north-central Siberia was simply amazing: over 5 standard deviations above the 1981-2010 normal. Here are maps from the ERA5 reanalysis and from surface station measurements (click to enlarge):
The agreement is very good: every station over a wide area in north-central Russia saw an annual temperature over 3 SD above normal, and 3 sites exceeded 5 SD in the region where ERA5 data highlighted the most significant anomalies. Of course there was a lot of very anomalous warmth elsewhere around the Northern Hemisphere (and globe) as well, but clearly Russia's Taymyr Peninsula was the epicenter of warmth.
Here's a chart showing the history of annual mean temperature for the 3 sites with over 5SD anomalies; Khatanga was the "winner", with a mean 2020 temperature of -6.4°C compared to a 1981-2010 mean of -12.2°C and standard deviation of only 1.1°C. February, April, and November were all more than 10°C above normal, 3 more months were over 5°C above normal, and only December was less than 2°C above normal.
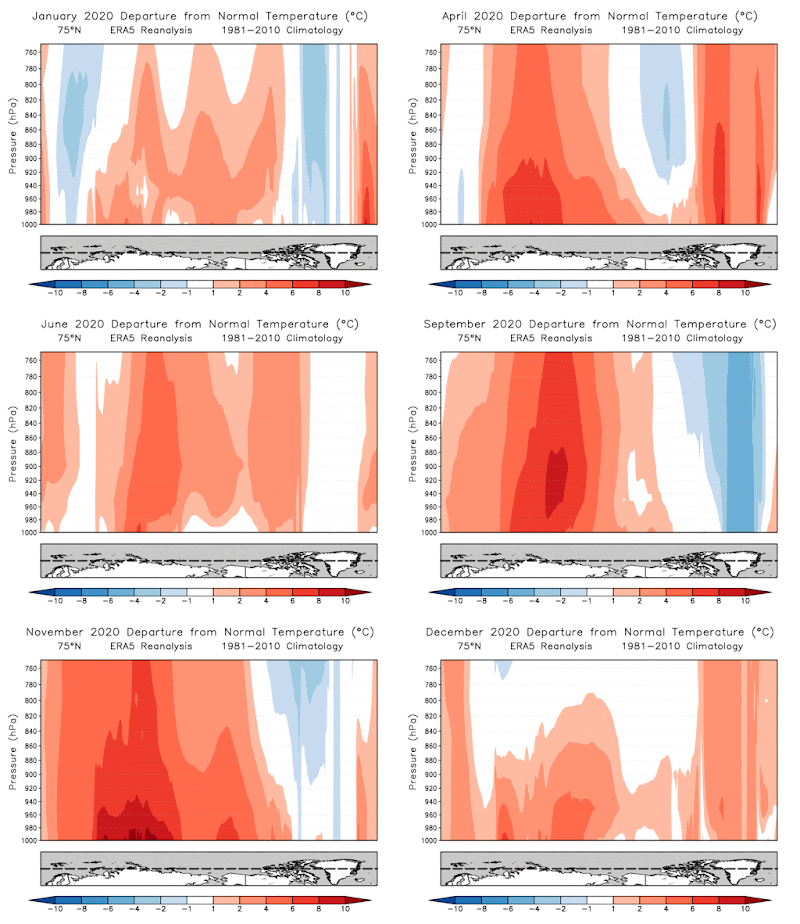
It's interesting to look at the vertical structure of the temperature anomalies using ERA5 data. Here's a cross-section around the Arctic at 75°N for the lowest 25% of the atmosphere. The departure from normal was far greater near the surface than aloft, although the anomaly for the year still exceeded 3°C at 750 mb (about 8000 feet elevation).
Here's the actual annual mean temperature (absolute, not anomaly) for the same cross-section:
And here's the 1981-2010 normal:
It's interesting to see that normally the annual mean temperature is approximately constant with height up to about 900mb in the vicinity of the Taymyr Peninsula, and farther east the normal temperature profile shows an inversion over the East Siberian, Chukchi, and Beaufort Seas. But in 2020 the more well-mixed environment of the Barents Sea extended dramatically farther east than normal (on an annual-mean basis).
Here's an animation of the temperature anomaly cross-section on a monthly basis. Again, the sheer persistence of the warmth in north-central Russia is remarkable.
What causes can we identify for the amazing 2020 anomaly? Extraordinary conditions began to emerge early in the year in association with a strongly positive phase of the Arctic Oscillation that swept warm Atlantic air eastward across Siberia and the Russian Arctic. Warm westerly flow therefore dominated the first three months of the year in association with the AO, and then as winter gave way to spring, the pattern shifted in such a way that very warm air continued to flow into the region; this new setup involved a trough over western Russia and a ridge over central Siberia. See below for January-March and April-May 500mb height anomaly maps.
With the arrival of summer, the circulation pattern shifted again, and yet again it favored unusual warmth along Russia's Arctic coast, but by this time I think the feedback associated with reduced sea ice and soil moisture was at least as important for maintaining the warm anomaly. Owing to the winter and spring warmth, Arctic sea ice was much thinner than normal near Russia's coastline, and it quickly broke up over the East Siberian Sea in June and July, removing a key cooling mechanism that would normally be present near the coast until much later in the summer.
Another factor that drove unusual warmth through the summer was the prevalence of dry soils caused by the early loss of snowpack and greatly enhanced drying under warm conditions - and also exacerbated by high pressure and reduced rainfall over central and eastern Siberia. Wildfire activity was widespread and intense. Here's a late August soil moisture map from ERA5.
As summer ended, the impetus towards unusual warmth was then reinforced with new vigor into the autumn months as sea ice was far below normal across most of the Arctic; the Arctic-wide ice extent almost set a new record low in 2020. The excess heat available from open ocean rather than ice-covered ocean has been a major contributor to enhanced warming trends in the Arctic during autumn over the last two decades.
Finally, to top it all off, the Arctic pattern returned to a strongly positive AO phase in November, bringing a renewed warm westerly flow to the Russian Arctic. Khatanga saw its warmest month of the year in terms of departure from normal, with a massive +11.3°C anomaly: the November average temperature was -13.3°C versus a 1981-2010 normal of -24.5°C. December then brought cooler northerly flows, but the month was still warmer than normal.


No comments:
Post a Comment