Fairbanks airport finally had its first freeze of the season yesterday morning, marking the latest date on record for reaching 32°F. It's not, however, the latest date for dropping below 32°F; that didn't occur until October 5 in 2017. Here's a 2017 post talking about the remarkable warmth back then:
https://ak-wx.blogspot.com/2017/10/hard-freeze-yet-to-occur.html
In much the same way as in 2017, abundant cloud cover and high humidity are significantly responsible for the absence of a freeze until now in Fairbanks. Reader Gary commented about this last week: the dull and humid weather has been notable.
Here's a chart to show the evolution of daily mean humidity and cloud cover throughout the warm season this year; the smooth black lines indicate the 1991-2020 normal values.

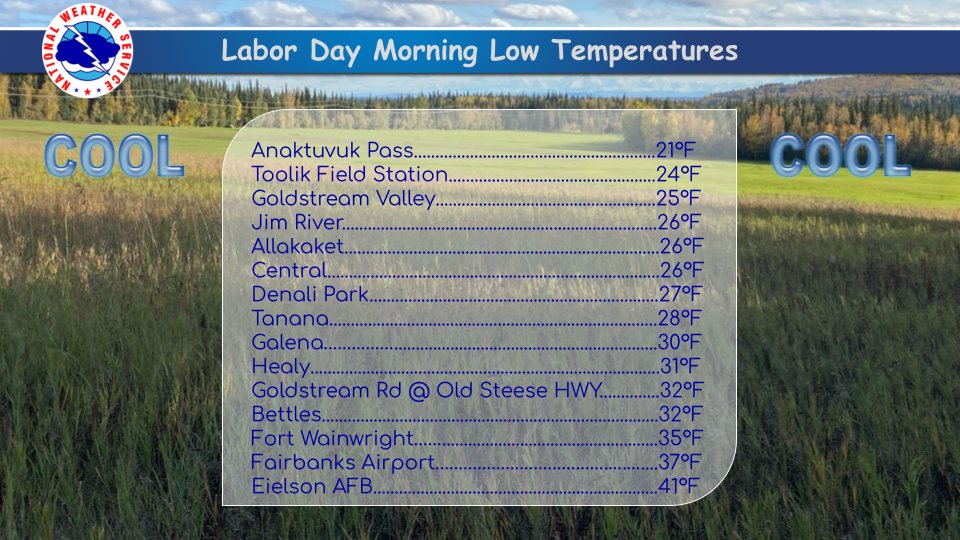
The sudden arrival of clear skies is what has finally allowed the overnight temperatures to drop off to more seasonable levels, and even a bit colder than normal this morning (below 20°F in the coldest spots, including Eielson AFB).


As we would expect from the abundant cloud cover, daily high temperatures have been quite suppressed in Fairbanks lately:

The average difference between the daily high and low temperatures has been the smallest since 1985 for the month of September. And yet total precipitation hasn't been much higher than normal.
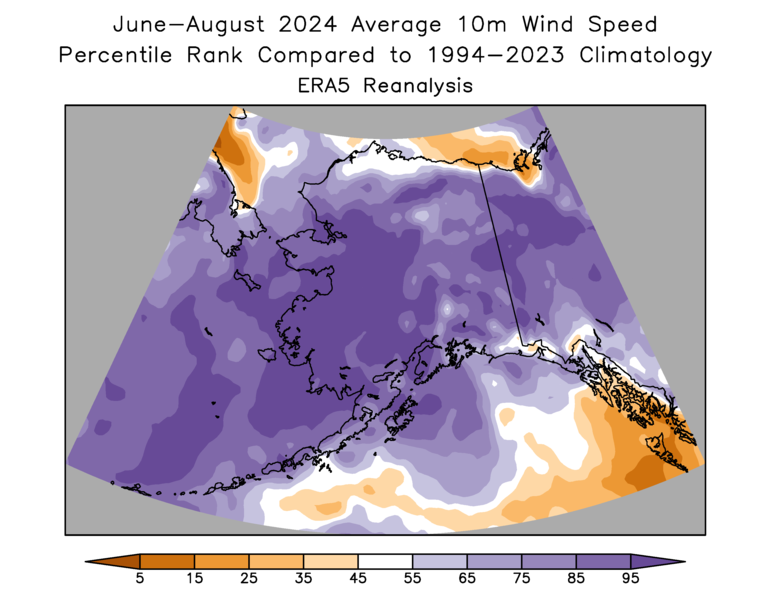
Here's the mid-atmosphere circulation anomaly responsible for the dreary conditions: a trough extending eastward from Russia.