Saturday, January 23, 2016

PDO, ENSO, and Temperature Extremes

I've recently been doing a bit of research to see how the phases of the PDO and El Niño/La Niña affect temperature extremes during winter in Alaska.  We've previously looked at changes in the distribution of seasonal mean temperatures, but the frequency of extremes is a different question that is very important for some applications.

I'll start with a map showing the frequency of warm and cold extremes during El Niño winters, regardless of the PDO phase - see the first image below.  I've defined the extreme thresholds as the 2nd and 98th percentiles of the daily historical distribution of daily mean temperature, so the thresholds are different for every day and are equally likely to be exceeded at any time of year.  The columns on the map show the frequency of exceedance for 22 winters with the highest November-March mean Oceanic Niño Index, i.e. the warmest one-third of winters since 1950 in the Niño3.4 region of the equatorial Pacific Ocean.  The heights of the columns show the exceedance frequency, with the horizontal dotted line indicating the long-term normal frequency of 2% (i.e. 3 days per winter).

As expected, warm extremes are more common than normal, and more common than cold extremes, during El Niño winters in south-central and southeastern Alaska.  This matches the sign of the seasonal mean temperature signal.  However, in western Alaska - and in Fairbanks - cold extremes are nearly as common as warm extremes, and neither is more common than normal, despite the fact that El Niño winters are more often warmer than normal overall.


If we look only at El Niño winters when the PDO is also in the top one-third of the historical range, the warm signal is much more widespread and is overwhelming in the south-central and southeast; cold extremes are almost unheard of when the oceanic temperature patterns show these anomalies.


In sharp contrast, when the PDO is either negative or near-neutral (i.e. bottom two-thirds of the historical range), El Niño winters generally fail to bring warm extremes, and cold extremes are quite heavily favored in most locations.  We see again that El Niño winters look vastly different depending on the PDO phase, and the difference is at least as dramatic for extremes as it is for seasonal mean temperatures.


Looking at the same analysis for La Niña winters, the results show that cold extremes are more common than normal and more common than warm extremes at every location; the cold signal includes western Alaska, unlike El Niño's warm signal.  However, it's interesting to note that the frequency of warm extremes is not reduced compared to normal from Anchorage to Barrow and throughout the interior; this is a result of increased variance during La Niña winters.


A negative PDO phase boosts the chances of very unusual cold conditions during La Niña, but the frequency of warm extremes still remains near-normal in the central part of the state; this is quite surprising, as I would expect these winters to be overwhelmingly cold.  It seems that, at least for the interior, a negative PDO is nowhere near as effective in amplifying La Niña cold as a positive PDO is in boosting El Niño warmth.


When La Niña is not accompanied by a negative PDO phase, the cold signal goes away and most locations see slightly higher chances of warm extremes than cold extremes.  Again it's notable that the PDO signal does not overwhelm the La Niña signal as it does for El Niño.  We might conclude that the PDO phase is less significant for Alaska's winter temperatures when La Niña is in play, and more significant during El Niño conditions; or alternatively we could say that La Niña is more reliably connected to unusual temperatures than El Niño.


Here is a corresponding set of maps conditioned on a positive or negative PDO phase, with or without El Niño and La Niña.  A noteworthy point here is that, during positive PDO winters, warm extremes are more common in the southwest (Bethel, St Paul, Cold Bay) when El Niño is not observed.  Similarly, during negative PDO winters, warm extremes are actually more common from Anchorage to Kotzebue and in the central interior during La Niña than during non-La Niña winters.


And finally, two maps showing the frequency of extremes for neutral PDO winters and neutral ENSO winters.  Notice that cold extremes are less common than warm extremes in many locations when the ENSO phase is near neutral.


Tuesday, January 19, 2016

Mid-Winter Fairbanks Update

The midpoint of meteorological winter season has just passed, so it's a good time to take a look at how the winter has turned out relative to normal so far.  To probably no one's surprise, it has been a warm one so far in Fairbanks, with the November 1 - January 15 mean temperature being the 7th highest on record (1930-present); but it's not as warm as last year, which was the 2nd warmest on record during the first half of winter.  Two years ago it turned very warm in the second half of January but there were several brief cold spells earlier in the winter (see charts below).


Temperature measurements from balloon soundings show that the warmth has become pronounced and persistent in the past few weeks, and in fact this morning's 850 mb temperature of -12°C was the first below-normal temperature at that level since the day after Christmas.  For 9 straight days around the turn of the year there was above-freezing air aloft in the Fairbanks sounding, which is almost unprecedented during December through February.  Only January 2014 had a longer spell of above-freezing air aloft in deep winter (10 straight days).


An interesting aspect of the vertical temperature profile so far this winter is that the warm anomaly has been quite shallow, with the average temperature anomaly dropping off quite rapidly with height (see the right panel in this year's chart above).  Since November 1 the mean temperature difference between 925mb and 700mb has been over 7.5°C, which is a record for the post-1991 period in which 925mb temperatures have been measured on every sounding.  The normal difference between these two levels is 4.8°C.

The rapid cooling with height is partly just a consequence of the fact that temperatures vary less in the middle and upper troposphere than they do at the surface and lower troposphere; so it is characteristic of a warm winter to have an enhanced vertical temperature gradient.  But there is more going on this winter, as the mean 500mb temperature has actually been below normal since November 1.  The reason for this is that 500mb heights have been lower than normal over the Bering Sea and western Alaska, and the trough axis (cold aloft) has been located not very far to the west.  However, at lower levels there has been strong warm advection from the south in response to low pressure in the Bering Sea.  This pattern of differential temperature advection (warm below, cold above) is what you get when there is a trough in close proximity to the west.

The maps below compare the normal height pattern to this winter's height pattern, for 500mb (top 2 maps) and 925mb (bottom 2 maps).
 
 
When it comes to precipitation and snowfall, it's been a tale of two winters so far in Fairbanks, with very snowy conditions in November but almost nothing since.  The 0.07" of liquid-equivalent precipitation and 1.7" of snowfall since December 1 is the 3rd lowest on record for this period, whereas November was the wettest since 1970.  The November precipitation was higher than the median for the first half of winter, so winter-to-date precipitation is still above normal; but this may not last much longer, as strong El Niño conditions are quite strongly linked to warm and dry conditions across interior Alaska in February and March.  The maps below show the temperature and precipitation patterns for late winter during the top 10 strongest El Niño episodes since 1950.


The chart below is an update of an earlier figure showing this winter's precipitation compared to the accumulated precipitation during 3 previous years with strong El Niño conditions in early winter.  In the 2 strongest El Niño's of the modern era, 1982-83 and 1997-98, Fairbanks precipitation saw a substantial deficit in the second half of winter.  It appears Fairbanks is already heading in the same direction this winter.


Wednesday, January 13, 2016

Allakaket Winter Temperatures

I've been rather too busy to focus on new blog material lately, but after posting about O'Brien Creek a couple of weeks ago, I started thinking about another wintertime cold spot that Rick mentioned some time ago.  I can't find his comment now, but I clearly recall him stating that Allakaket is "much colder" than Bettles in winter; so I figured it would be worth posting another set of comparison plots.  The two villages are about 40 miles apart on the Koyukuk River, with an elevation difference of 240 feet (Bettles being higher).

Allakaket was an active climate reporting station in the early 20th century and historical data exists with varying degrees of completeness up until 1982; but sadly there's nothing in the GHCN database since then.  Bettles started reporting in 1951, so in theory we have 30 years of overlap between the two sites, although Allakaket has many periods of missing data.  Using only the days with both maximum and minimum temperature reported at both sites, I calculated the monthly mean temperatures for the period of overlap, and the results show that Allakaket was indeed much colder - see the chart below.


It's remarkable to see that average daily minimum temperatures were more than 10°F colder at Allakaket from December through March, and daily maximum temperatures were 7°F colder in January.  The average January minimum of -29.7°F at Allakaket is lower than the modern average at either Chicken or O'Brien Creek, although here we are looking at the colder climate of several decades ago.

Looking at all winters with at least 90% complete and overlapping data, we can see that Allakaket was colder than Bettles every time, for both maximum and minimum temperature.  In the winter of 1976-77, Allakaket's low temperatures were 16°F colder on average.


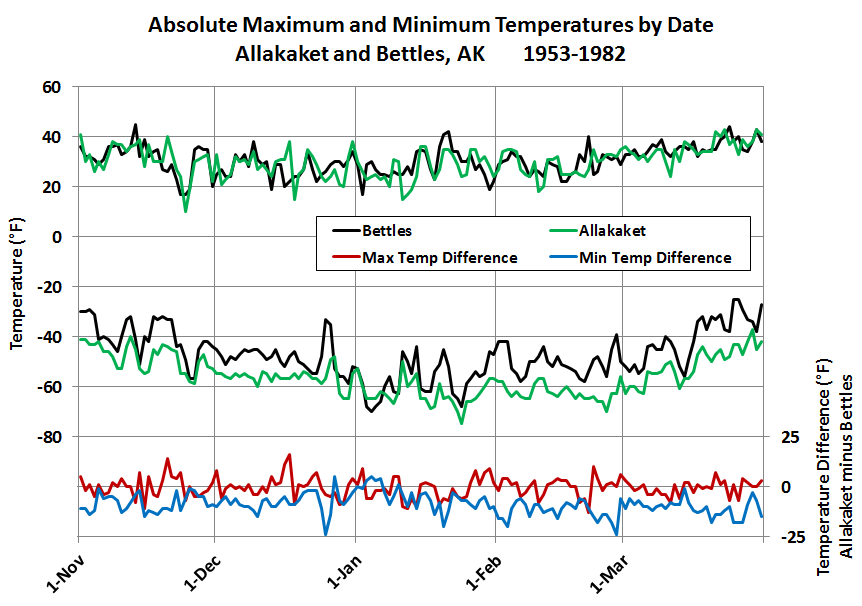
The absolute maximum and minimum temperatures for each date during winter within the overlapping period show a pronounced difference in the potential for extreme cold (see below); but the warm extremes are about the same, showing that Allakaket is just as capable of warming up when temperatures get far above normal.


Finally, scatterplots of the 3100 overlapping days show the joint distribution for daily maximum and minimum temperatures.  Notice the much higher number of days that dropped below -60°F in Allakaket compared to Bettles.  It's too bad that there is no weather observer in Allakaket these days, because it would be fascinating to see if these differences persist in the modern day, or if they were partly an artifact of a colder climate in earlier decades, with perhaps more clear skies and calm winds to help reinforce inversion conditions lower down the Koyukuk River valley.


Friday, January 8, 2016

1871 Whaling Conditions

In the past couple of days there have been some stories in the media about NOAA's expedition last year to locate the remains of the whaling fleet that was lost in unusual ice conditions near Wainwright in September 1871.  Here's a brief write-up from NOAA:

http://www.noaanews.noaa.gov/stories2016/010616-remains-of-lost-1800s-whaling-fleet-discovered-off-alaskas-arctic-coast.html

I thought it would be interesting to see if the 20th Century Reanalysis (which actually extends back to 1851) shows any hint of unusual weather conditions that could have created unusual pack ice close to the Chukchi Sea coast that September.  A Wikipedia article claims that "a stationary high, parked over northeast Siberia, reversed the normal wind pattern and pushed the pack ice toward the Alaskan coast"; I haven't yet examined other sources to see if there is good evidence for this, but it stands to reason that something like this probably happened.

The series of maps below shows the 20th Century Reanalysis sea-level pressure anomaly (departure from normal) for 4 consecutive weeks beginning with August 18-24, 1871.  The reanalysis shows lower than normal pressure in the Bering Sea, and a tendency for high pressure over Alaska - especially in the first week - but there is no evidence of a pressure pattern that would tend to drive ice into the coast near Wainwright.


The maps below show the 1000mb vector wind anomaly, which is the vector wind's departure from normal.  Again there is no evidence of unusual winds directed towards the Alaskan coast, and in fact the 1st and 4th weeks show the very reverse.  Unfortunately all this means is that the 20th Century Reanalysis doesn't appear to explain how the ice conditions became so severe; the reanalysis could be wrong, or there might be another explanation for the ice.  Given the presumably very sparse observational data back in 1871, it seems difficult to imagine that the reanalysis could have any real accuracy for this part of the world back then; but it was worth a look, I think.


Wednesday, January 6, 2016

Brooks Range Thaw

Deep southerly flow aloft continues to transport very warm air northward across Alaska, although the proximity of the upper-level ridge has allowed valley-level locations in the central and eastern interior to cool off recently.  Western areas are having no such luck; for example, Kotzebue has had 8 straight days with a high temperature at or above 32°F (including today).  This is an all-time record (1930-present) for the winter months of December through February (the previous record was 6 days on several occasions).  McGrath is at 9 days and counting with a high temperature of 35°F or higher, which is also an all-time record.

Here's this morning's 500 mb analysis, courtesy of Environment Canada; it's clear that the air now affecting Alaska was located far to the south not many days ago.


Temperatures above freezing have been reported at many mid-elevation locations on both sides of the Brooks Range in the past day or so.  For example, the Ivotuk CRN site at 1900' elevation remained mostly above freezing for a lengthy period yesterday, as shown in the following chart.


The nearby Howard Pass RAWS (2062'), notorious for its frequently severe wind chill, was also above freezing at times yesterday:


Farther to the east, Toolik Lake (2493') also experienced a thaw in the early hours of yesterday.


Other high temperatures include 35°F at the Imnaviat Creek SNOTEL (3050'), 38°F at the Sagwon SNOTEL (1000') on the North Slope, and 34°F at the Coldfoot SNOTEL (1040') on the south side of the Brooks Range.

Even Umiat, at low elevation on the banks of the Colville River, rose to 32°F yesterday evening.  This is not unprecedented, but certainly very unusual.


Friday, January 1, 2016

Chinook Winds

A wave of warmth has inundated Alaska in the last few days, and chinook winds have amplified the warming in much of the interior.  On Wednesday temperatures rose above freezing at locations spanning the state from west to east, including Nome, Kotzebue, Bettles, Fairbanks, and Eagle.  There have only been 10 previous days since 1952 (the common period of record) when all these stations made it above freezing on the same day in December through February; 6 of these 10 days have occurred since 2009.

The only portion of the interior that has stayed well below freezing is the far southeast, where the proximity of the upper ridge prevented winds from mixing down the warmth aloft; Northway has not exceeded 14°F.

Fairbanks airport reached 45°F on Wednesday, as the southerly chinook winds managed to break through the surface-based inversion for just a brief time in the afternoon; the temperature rose from 34°F at 1pm to 45°F at 2pm, and then dropped back to 30°F at 3pm and to 15°F by mid-evening as the stagnant colder air rolled back in.  A more extended period of gusty warm winds yesterday afternoon took the temperature back up to 40°F with a bit of mixed rain and snow.

Wednesday's fluctuations in temperature and wind speed in Fairbanks are evident in the half-hourly observations from UAF's Smith Lake site, see below.  The second temperature spike, with the larger wind speed spike, is the one that produced the high temperature at the airport, but at Smith Lake the temperature jump occurred between 12 and 12:30 (presumably AKST), i.e. at least 30 minutes earlier than at the airport.  The elevation difference between the two sites is only about 100 feet, but this might explain the delay in warming at the airport as the wind burst took time to mix down.


The relative humidity plot from Smith Lake shows the low humidity of the chinook air - see below.  The humidity fluctuations nicely highlight the contrast between the two air masses, one of them cold, humid, dense, and stagnant, and the other warm, dry, less dense, and moving quickly northward.  The density contrast between two such air masses is so great that they might be thought of as immiscible, like oil and water: they simply do not mix.  The warm air tends to slide over the cold air, and in the Fairbanks area the chinook flow doesn't often make it to the valley floor unless the pressure gradient is large or winds become unusually strong.


Similar charts from the Poker Flat Research Range, about 30 miles north of Fairbanks at ~700' elevation on the Chatanika River, show that temperatures were above freezing for two lengthy periods on Wednesday - see below.  The early afternoon spike in wind speed was also observed at this location (note that the time axis appears to be UTC), but the temperature rise was more gradual as there was less stagnant, stable cold air to displace at the higher elevation.