Tuesday, May 17, 2016

Reality Check

In a reminder that summer isn't quite here yet, a dramatically cooler air mass has pushed into the northern and eastern interior in the past couple of days.  Yesterday was the first day since March 19 that the daily mean temperature was below normal in Fairbanks; 57 straight days were warmer than normal.

Saturday's high temperature of 82°F was the second earliest on record for such warmth, as only the great May heat wave of 1995 was more anomalous (88°F on May 11).  Ten years ago, in 2006, Fairbanks never even reached 82°F all summer long.


The sudden flip to chilly conditions today probably shouldn't be too surprising, as we noted last year that extreme warmth at this time of year seems to invite a strong reversal of temperatures.  In 1995, the high of 88°F on May 11 was followed by a low of 32°F on May 15, and then it turned even cooler, with a high of only 49°F on May 21 and a low of 28°F the next day (one of the latest occurrences of a 28°F freeze).

If today's high temperature in Fairbanks is in the 40s, as appears likely, then this will be a rare instance of the temperature exceeding 80°F before mid-summer and then a subsequent day (prior to autumn) failing to reach 50°F.  This has only happened before in 1963 and 1995.  Today is certainly quite cool, with 5pm temperatures of 35°F at the Chatanika RAWS (1626') and on the Parks Highway at Nenana Hills (1421'); and it's below freezing at Eagle Summit.  [Update: the temperature at the airport reached 51°F after light rain ended.]


Webcam images from Ester Dome above Fairbanks captured some snowflakes earlier this afternoon, and the Central webcam is showing fresh snow cover in the hills.  Farther afield, Eagle and Northway both reported some light snow earlier in the day.


The 500mb analysis from 4am AKDT today (courtesy of Environment Canada) shows the upper-level flow pattern responsible for the change: note the mid-tropospheric low right over the central interior.


Friday, May 13, 2016

Possible End to Warmth

While making a routine seasonal forecast the other day I stumbled on something surprising and, I think, quite interesting.  Here's what I came across: the map below shows the temperature pattern during summers (June through August) following a strongly positive PDO phase in late winter (February through April).


This year, as we all know, the PDO phase has been extremely positive so far; the February-April average PDO index was second only to 1941.  With above-normal temperatures continuing in apparently unending fashion across Alaska this spring, it is interesting to see that summer tends to be cooler than normal when the PDO is strongly positive in late winter.  Note that this is not because the PDO suddenly turns negative in these years; out of the 10 years shown above, the June-August PDO remained strongly positive in 4 of 10 years.  Two more of the years had a significantly positive summer PDO, and it was close to neutral on average in 3 years and became negative in only 1 year.

The map above is derived from the NCEP/NCAR reanalysis, which as we've seen before is not very good at all for Fairbanks temperatures in summer, so I checked the result with station data from Fairbanks.  Here's what the analog years looked like in Fairbanks; I've plotted the monthly temperature anomaly normalized by the standard deviation.  The black line shows the median of the 10 years for each month.


As expected the late winter and spring tend to be warmer than normal when the PDO is strongly positive, but the warm anomaly goes away by June, and each month from June through September is more likely to be cooler than normal.  Remarkably, August temperatures were nearly 1 standard deviation below normal on average in the 10 analog years.  It's fascinating also to see the warmth return in October and November.

Here's the corresponding chart for precipitation, expressed as a percentage of the 1981-2010 median for each month.  Dry conditions are typical in January through March in these positive PDO years, but the normally dry month of April is often relatively moist - as happened this year.  There is not much signal for precipitation in the rest of the year; May, June, and September show a tendency to be dry, but July and August show no marked departure from normal.


We can get a sense of the progression of the temperature signal by looking at month-by-month patterns from the reanalysis for the same analog years:


The expansion of the cool anomaly in August and September is pretty remarkable.  The maps below show the sequence of events from the perspective of 500mb height, with yellows showing a tendency for above-normal height (ridging or high pressure) and blues showing below-normal heights.  It appears that the interior's cool weather in June and July tends to be associated with high pressure to the north and cool northeasterly flow.  However, in August there is a strong tendency for a trough over the Beaufort Sea, which would bring a cool airmass to interior Alaska from the west or northwest; and in September there is often troughing over southeast Alaska, which is certainly a cool pattern.


Despite the lack of an obvious signal in the Fairbanks precipitation data, a broader look at precipitation in the analog years suggests that July is more likely to be wet than dry.


The other summer months don't show a notable precipitation signal, but the reanalysis solar radiation data suggests that relatively sunny conditions are favored in August and especially September (see below).  So if we look all the way ahead to early autumn, the PDO analog suggests that relatively chilly and clear conditions may be likely.  It will certainly be interesting to see if 2016 matches the historical pattern.


Update: for comparison, here's NOAA's forecast for June-August, issued last month.  NOAA will update their forecast on Thursday, but I doubt it will change much.


Saturday, May 7, 2016

Sea Ice Forecast

It's interesting to note that NOAA's CFSv2 long-range forecast model is again predicting a very substantial increase in sea ice this summer in parts of the Arctic Ocean.  The map below shows a large positive anomaly in sea ice concentration in August stretching from the eastern Kara Sea all the way east to the Beaufort Sea.  If this was the first time we'd seen this, it would be worth paying attention, but the model produced a similar forecast in 2014, and it proved to be completely wrong (see here and here).

The CFSv2 "nowcast" for May shows a large ice deficit in the Bering Sea (see below), which is correct, so it seems the model is not developing the summer ice excess from erroneous initial conditions; the anomaly is being generated from the internal physics of the sea ice component of the CFSv2 system.  Assuming the forecast proves incorrect again, I'd say this aspect of the model needs some attention.

According to the forecast, the sea ice anomaly persists into the autumn and helps generate a really remarkable cold anomaly on this side of the Arctic - see the temperature forecast map for October, below.  It seems very unlikely indeed that anything remotely like this will happen; simply put, I think the model is "out to lunch".  But time will tell.  (As an aside, note the La Niña cold anomaly in the equatorial Pacific; this is reasonably likely to be correct.)

Here are the latest charts of observed Arctic sea ice from NSIDC; total ice extent is running close to record low levels for the time of year, and there seems to be a fair chance of a new record melt-out later this year.  Unless of course the CFSv2 is onto something.


Thursday, May 5, 2016

Unending Warmth

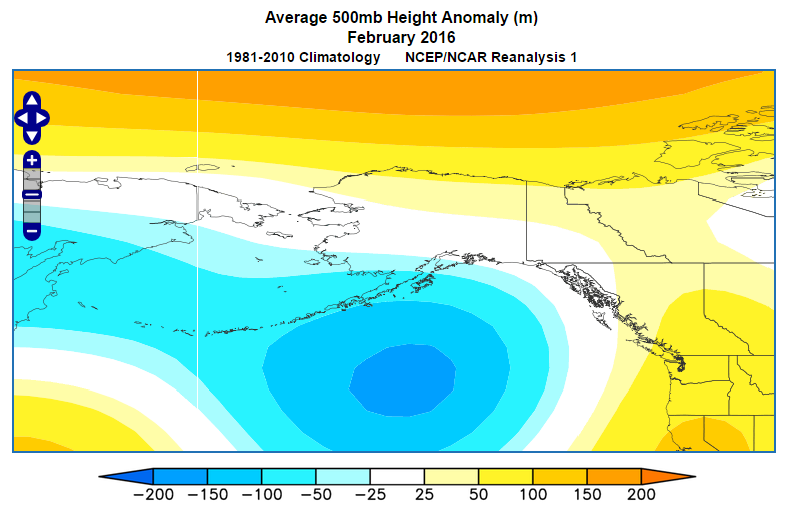
The persistence of abnormal warmth in Alaska in the past few months has been nothing short of amazing.  A strongly positive PDO phase and strong (though now decaying) El Niño conditions have maintained a remarkably steady circulation pattern over the northeastern Pacific sector, leading to a seemingly never-ending flow of warm air into Alaska.  The maps below show the remarkable month-to-month similarity of the 500mb height anomalies so far this year:


In Fairbanks the daily mean temperature has been above normal every day since March 20, which makes 47 days in a row including today; this is the most on record for the time of year. (There have been a couple of times when above-normal conditions persisted longer in early winter.)  For the year to date, the temperature has been above normal 115 out of 126 days, which is also the most on record for this period of the year, by some margin (see chart below).  However, the year is not yet running as the warmest on record; 1981 was warmer through this date, owing to some incredible warmth in mid-winter.


Incidentally, notice in the chart above that most years within the 1981-2010 "normal" period had more than half of days above normal; the average is actually 54%.  This is because the distribution of daily temperatures is negatively skewed at this time of year; large cold anomalies are more common than warm anomalies of the same magnitude, and more than half of all days are warmer than the mean temperature.

The chart below tells the tale for Fairbanks temperatures since November and needs no comment.  I was beginning to think Fairbanks might not even see a freeze in May this year, which would have been unprecedented; but this morning's low temperature was 31°F at the airport.


Tuesday, May 3, 2016

Breakup Progress

Now that I'm back from my lengthy trip, the first order of business seems to be to look at how breakup is playing out.  Today's NWS breakup map (below) shows that breakup is mostly complete in the southern and eastern interior, and the Yukon River is currently in the process of breakup, with the ice having gone out at Tanana on Friday and at Fort Yukon on Saturday.  This is all considerably earlier than normal, of course.


As many readers know, the Nenana tripod moved out on April 23, which is only 1 day earlier than last year and does not match the April 20 record.  However, breakup was the earliest on record by a significant margin on the Kuskokwim River at Bethel and on the Yukon River at Dawson in Yukon, Canada.  The charts below show the annual breakup dates for the common period of record at these locations.  It's interesting to see that the variance is a lot larger at Bethel than at Dawson, and the long-term trend towards earlier breakup is somewhat less at Bethel.  Of the 3 locations, the trend is strongest at Nenana.


A scatterplot comparison of the breakup dates reveals that Bethel's breakup is rarely earlier than Nenana's (as occurred this year), although it has been as much as 11 days earlier (in 1927).


Breakup timing at Nenana is more highly correlated with Dawson than with Bethel, as might be expected based on closer proximity and a more similar (interior) environment.


Lastly, here's the final result for the chart of thawing degree days that I showed before.  Breakup at Nenana didn't occur until TDDs reached 216, which is twice as high as last year.  It's tempting to speculate that the resilience of the ice this year may have been related to the amazing lack of snow during most of the winter: a lack of insulation may have allowed the ice to become stronger than would be expected based on the mild temperatures.  However, the peak ice thickness of 40 inches at Nenana was only slightly greater than last year, so I'm not sure if this idea holds water...


Wednesday, April 20, 2016

Seasonal Forecast

Here's a quick update to show the latest CFSv2 model forecast for next month.  The model ensemble is calibrated with the historical re-forecasts and converted into the probabilities that the climate anomalies will be significantly below-normal, near-normal, or significantly above-normal.  The temperature forecast for May shows continued high probabilities of unusual warmth for most of Alaska, exceeding 90% over the warm water in the Gulf of Alaska and Bristol Bay, and 60-70% in most of the interior except the east.


The forecast for the May through July average is similar, although the probability of warmth is not quite as high in the interior.  There is a surprising area of expected cooler than normal conditions in the Chukchi Sea; this is probably related to the CFSv2 sea ice forecast, which is not known to be particularly reliable.


Interestingly the 3-month forecast for sea-level pressure shows a low pressure anomaly across interior Alaska, and the precipitation forecast hints at above-normal rainfall in the southeastern interior.


The probability forecast for Fairbanks shows a modestly enhanced probability of a wet May-July period, and it seems the model expects this anomaly to show up in July; the probability of significantly above-normal rainfall in July is 48%, compared to 36% for the near-normal category and only 16% for below-normal.


The official CPC forecast will come out tomorrow:

http://www.cpc.ncep.noaa.gov/products/predictions/long_range/

Also, I added the March verification at the end of my post from 2 months ago:

http://ak-wx.blogspot.com.es/2016/02/seasonal-forecast.html

Update: here's the CPC forecast; the most interesting aspect may be the expectation for above-normal precipitation across northern Alaska in May-July.  It's also interesting that the CPC doesn't buy the CFSv2 forecast for an increased chance of wet conditions in southeast Alaska.


Wednesday, April 13, 2016

Breakup Update

This is just a quick update to note that Fairbanks thawing degree days exceeded 100 yesterday, which is not far off the record pace of 1940; but a cooler air mass has moved in and the next week appears likely to be cooler; so a record early breakup at Nenana (before April 20) no longer appears quite as likely.  The chart below shows the updated 2016 TDD trajectory (solid line) along with the latest GFS MOS forecast through the 20th (dotted line).


In Fairbanks it appears that the Chena River has gone out or is about to:


Regular readers should note that I'll be traveling in Europe for the rest of this month, so posting will probably be sporadic and brief.

Saturday, April 9, 2016

Snowpack Meltout

Despite a few hours of accumulating snow yesterday morning in Fairbanks, today's climate report shows only a "trace" of snow on the ground, which means the winter snowpack has officially melted out.  In practice it means that less than half of the ground area was snow-covered at midnight last night in the vicinity of the upper-air observation site at the airport.

The chart below shows the date of meltout for Fairbanks since 1930.  As Rick Thoman noted on this blog at meltout 5 years ago, there is no long-term trend.  There have been decadal-scale variations, such as periods of early meltout in the early decades and late meltout around the 1960s, but recent decades have not been unusually early on the whole.  The only possibly noteworthy aspect of the past 20 years is how few years have been very anomalous: only 2 years have seen meltout before April 16, and only 2013 was later than May 2.


The absence of a long-term trend is surprising in view of satellite indications that Northern Hemisphere spring snow extent has decreased in recent decades.  See, for example, the following articles:

https://nsidc.org/cryosphere/sotc/snow_extent.html

https://www.climate.gov/news-features/understanding-climate/climate-change-spring-snow-cover

It's also surprising that Fairbanks meltout dates have remained steady when we consider that spring temperatures increased substantially in the 20th century (with the main increase occurring at the 1976 PDO phase change).  The chart below illustrates this and also provides at least part of the answer for the meltout mystery: late winter snow depths have also increased over time.  It seems that increasing temperatures have been offset by greater snowpack depth, and so there's been no significant change in the timing of spring snowpack elimination.


Tuesday, April 5, 2016

Nenana Ice Classic

The 100th Nenana Ice Classic closes to entries today, and I'm guessing those entries are heavily front-loaded towards an early breakup, given the warm weather of recent weeks and months in interior Alaska.  The ice is slightly thicker than it was last year at this time, but the visual appearance has been quite poor, judging from the webcam view in recent weeks.  It's actually looking a bit better today thanks to a little fresh snow on Saturday night.


I've mentioned before that April mean temperatures in Fairbanks are highly correlated with the breakup date at Nenana - see the chart below.  The warmest April in Fairbanks history was in 1940, and that year also produced the earliest breakup on record - narrowly ahead of 1998.  However, the early breakup of 1940 was quite an outlier for those early decades; 6 of the earliest 7 breakups have occurred since 1990.  In the past few decades, it's been more common to see breakup in April than in May, in contrast to earlier years.


Another way of looking at the relationship between breakup and temperature is to calculate the thawing degree days up until the date of breakup.  Thawing degree days (TDDs) are the accumulation of temperature excess above freezing; for example, a daily mean temperature of 42°F equates to 10 TDDs.  If we add up the daily TDD values for each year between March 1 and the date of breakup, we get the following chart:


The first thing to note is that there is quite wide variation in the amount of thermal energy needed to produce breakup, as measured by TDDs; since 1930, the Fairbanks TDDs have varied from 75 (in 2002) to 265 (in 1975).  It's slightly counter-intuitive to see that the latest breakups occur after a relatively small accumulation of TDDs; the reason for this (I believe) is that late breakups allow more time for the increasingly intense solar radiation of May to work on the ice, even though air temperatures are low.

In contrast, if breakup is to occur early, then melting has to be accomplished more by the warmth of the air than by direct solar heating, and so warmer temperatures are required.

We can see that recent decades have been characterized more by early breakups in association with large TDDs, in contrast to earlier years that tended to have smaller TDDs and later breakup.  The last two years, 2014 and 2015, were actually a little unusual in having early breakup AND relatively low TDDs - perhaps a consequence of the warm winters and poor ice conditions.

So far this spring Fairbanks is accumulating TDDs more rapidly than in the past 3 years, although it's not a record; in 1965, 45 TDDs were observed already by April 4 (but breakup didn't occur until May 7).  According to today's 7-day NWS forecast, Fairbanks will accumulate another 29 TDDs through April 11, putting the total at 59.  There doesn't seem to be any sign that the warm weather will abate in subsequent weeks, so the melting rate will probably accelerate in the middle of April, especially as snow cover will be gone by then.

Subjectively, then, it seems we are on pace for something pretty close to a record early breakup, but much will depend on just how warm it is after April 15.  I'd say the most likely window for breakup at Nenana is April 21-24; and that's probably close to what everyone else is thinking without any of the temperature analysis.  In other words: your guess is as good as mine.