
Interestingly, if you look at the wind speed over time, there is a noticeable downward trend – including an abrupt shift in 1998. Figure 2 shows the average annual wind speed for Fairbanks between 1984 and 2013. The speed was consistently above 5 mph before 1998 and mostly below 4 mph after 1998. To see if this is an anomaly or if other stations have the same issue, I made a chart of the 19 stations that have nearly complete data between 1984 and 2013. They all show a downward trend in wind speed and many have the same shift in speed in 1997 or 1998 but to a lesser degree. Figure 3 shows the result of that analysis. My guess is that a change in equipment protocol was implemented in the that time period. The method for estimating both visibility and sky conditions changed during that same time period so it is not unreasonable to assume wind speed measurement protocols changes as well. It is also possible that the downward trend in Alaska's wind speed is related to a similar reduction in wind speed noted across the Lower 48. Several researches have previously noticed this effect and a possible attribution to a diminished thermal gradient between the equator and the poles is a sound hypothesis. The thinking is since wind is generated by the pressure-gradient force and differences in pressure are a result of differences in density (which are a result of differences in temperature), a diminish thermal gradient will result in a lower pressure-gradient force – and therefore a lower wind speed.
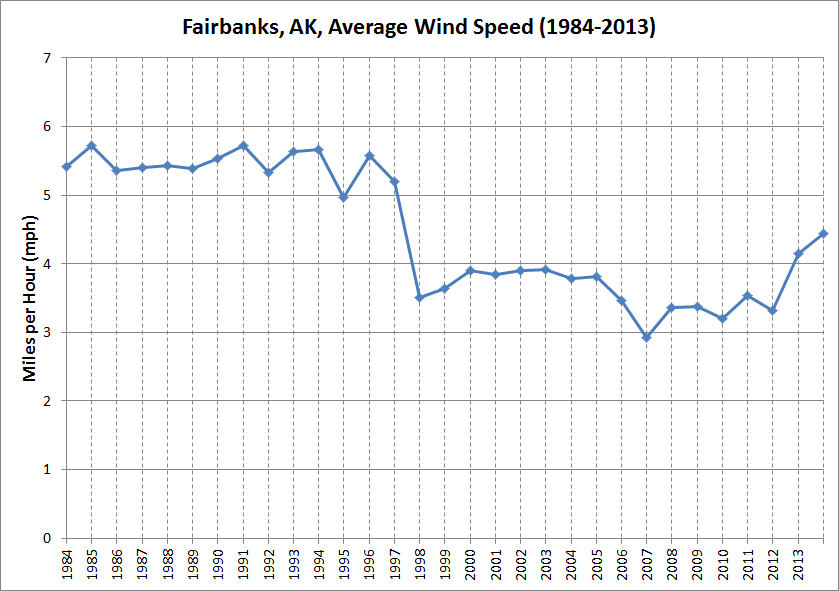
Figure 2. Average annual wind speed in Fairbanks, Alaska (1984-2013).


Figure 4. Average annual wind speed at 229 stations in the U.S. (1984-2013). Only stations with 28, 29, or 30 years of data were included.

Figure 5 (added by Richard James). Mean annual wind speed at 850 mb (1950-2013) for Anchorage, Fairbanks, and Barrow.

Figure 6. Change in wind speed of two 10-year periods for the entire U.S. measured in miles per hour. Note: this has not been cross-referenced for station location changes or equipment changes.

Fair-Banks deserves its name as far as weather. Go any direction a few miles and the WX changes per RAWS and personal observations. Our little Cul-de-sac with its special climate.
ReplyDeleteJust got back from 18 days 93 miles SW of town at my remote camp. Blew 15-25 with periodic gusts over 40 for a week early in the stay on my hand recording wind meter. Not 100% accurate but when the spruce lean over 20+ deg, it's moving some air. The Wien RAWS (WNLA2) is ~ 10 miles to the south and often reports a brisk breeze from outflow from the Yukon Flats to the north and the Tanana Jet to the east.
What strikes me is the prolonged clear spell we've enjoyed in Interior Alaska. I saw small clouds far away on only two days, and the Denali complex was clear the whole time.
The persistent High ridge over northern Alaska apparently did its job of repelling and sucking the energy out of any Lows that attempted the intrusion.
Gary
Welcome back Gary. It has been amazingly clear and calm down this way too. Today will be the 15th day in a row with nary a cloud in sight here in Anchorage. It will also be the 15th consecutive day with a low temperature below normal and a high temperature above normal. The previous record (for Anchorage) was 11 consecutive days.
DeleteBrian, That is simply amazing for Anchorage. I don't recall ever seeing more than about three or four completely clear days in middle or high latitudes. In England, where I'm from originally, there is virtually always some cloud somewhere - I have spent years waiting for even one completely clear day.
DeleteEven if you allow for a discontinuity in 1998, I don't see a statistically trend that is going down. It looks like two flat trends with the jump in 1998. It bothers me when a straight line is forced to fit a step function.
ReplyDeleteI've heard of the jet stream slowing down (though I think the data is too variable to draw such a conclusion) but I don't see how wind data can be used to see a slow down and be still significant.
The interior weather really has been beautiful.
Eric, I added a new figure at the end of the blog post. It shows the average annual wind speed at 229 stations in the U.S. between 1984 and 2013. The downward trend is quite apparent. In looking around for a few minutes this morning, there have been somewhere around 2 dozen articles that discuss this topic. What I have seen is that a large fraction is hypothesized to be a function of changes in surface roughness due to land use and land cover changes. The rest of the changes are hypothesized to be a result of the well-documented shift in the Jet Stream and changes in the amount of aerosols released. Here are a few articles to check out:
Deletehttp://www.iac.ethz.ch/people/abichet/Bichet_2012.pdf
http://iopscience.iop.org.proxy.consortiumlibrary.org/1755-1315/6/9/092023/pdf/1755-1315_6_9_092023.pdf
http://digitalcommons.unl.edu/cgi/viewcontent.cgi?article=1397&context=geosciencefacpub
This is interesting. The step down in 1998 looks very much like a change in equipment and/or measuring protocol (introduction of ASOS? we have discussed this before). But there may be a long-term trend as well. I pulled out the mean annual wind speed at 850 mb, and Fairbanks does show a slight decline since the 1950's and 60's; Anchorage and Barrow show smaller changes. However, the drop in 1998 is much less dramatic at 850 mb.
ReplyDeleteIt may be worth calculating the mean annual pressure gradient at the surface from the reanalysis data, to see if a lower wind speed can be explained by a slackening of the gradient. I'll try to take a look at that.
Forgot to mention that I took the liberty of adding a chart at the end of your post, Brian, to show the 850 mb wind changes.
DeleteIt looks to me that the 850 chart shows no statistically significant downward trend but a few regime changes - maybe PDO. And the annual US winds appear to suffer from the 1998 change and have no relevant downward trend. It appears to me to say otherwise is just bad statistics. Maybe a more formal treatment will show something useful. But the given chart alone doesn't.
DeleteEric, it is very possible that either an equipment change or some other data collection issue is what's going on. I'll add that since some researchers have been investigating this phenomenon that there is probably something there.
DeleteAccording to the HOMR metadata system, the station was moved to its current location (at the SW end of the runway) in 1997 from a location near the main airport terminal building. This is a distance of 1.2 miles. There is no mention of changes to the wind sensor from a cup anemometer to a sonic anemometer or anything like that. Eric, I also added some maps that I made for the Lower 48 and wind speed. Ideally, a study would only use those stations that did not move during the 30-year time period. It would make a good Master's Thesis in my opinion.
ReplyDeleteThank you for the maps.
DeleteLooking at the US maps without the mid-90's jump, you see regional patterns. This to me is significant and obviously would be worth looking into (as apparently some have).
I wonder if the increase in wind in south New Mexico is from any changes in the monsoon season. And how has the frequency of hurricanes affected the southeast.
where did you get your data from?
ReplyDeleteI think Richard raises a fair point here.
Delete