Tuesday, August 6, 2013

Warm Surge

Here's a nice visible satellite picture of the low pressure system currently spinning over the ocean south of the Alaska Peninsula.  The low was analyzed at 983 mb this morning, making it the deepest low to the south of Alaska since April.  Far to the northeast, over Canada's Northwest Territories and Arctic Archipelago, there is an enormous blocking ridge, as evidenced by the mostly clear skies in the interior.


As the low weakens and pulls back to Bristol Bay in the next couple of days, a powerful surge of warm air will be drawn northwestward across interior and northern Alaska.  The most unusual conditions relative to normal may be along the eastern North Slope, where the computer models are indicating 850 mb temperatures above 15 °C by late tomorrow.  The forecast graphic below shows a time-height cross-section of temperature at Barter Island; the horizontal axis shows time (UTC) increasing to the right, beginning at 12 UTC (4 am AKDT) today, while the vertical axis indicates pressure in mb.

It seems rather likely that some high temperature records may be broken across northern Alaska in the next day or two.


Monday, August 5, 2013

Uniform Temperature Days

Last November I noticed that Juneau had a day where the high and low temperatures were identical. It got me to thinking about how common of an occurrence this is. Well, here is the answer for the "Big 3" cities in Alaska. Surprisingly, Fairbanks has had more of these days than either Anchorage or Juneau. Note: I will check surrounding stations for the June 1905 occurrence in Fairbanks.

Anchorage - 1 occurrence
1/8/1917  Max = 11, Min = 11

Juneau - 2 occurrences
10/26/1942    Max = 57, Min = 57
11/13/2012    Max = 32, Min = 32

Fairbanks - 3 occurrences
11/12/1904    Max = 10, Min = 10
6/25/1905    Max = 54, Min = 54
12/24/1909    Max = 8, Min = 8

Sunday, August 4, 2013

Unusual Temperatures

As a follow-up to Brian's and Rick's illuminating posts on Friday and Saturday, I thought it would be interesting to examine more closely how "unusual" the "unusual temperatures" of 2013 have been.  Brian showed that, in Fairbanks and Anchorage, temperatures more than 1, 2, or 3 standard deviations from the mean have occurred much more often in 2013 than would be expected based on the normal distribution.  The question is, how often does this occur, or might it be unpredecented in the modern historical record?

The charts below show the number of days each year since 1931 when the daily mean temperature was more than 1, 2, or 3 standard deviations from the preceding 30-year average, for dates between January 1 and August 2.  Note that I compared the temperatures to the preceding 30-year average rather than the 1981-2010 average to help reduce artifacts associated with the long-term warming trend.  For example, temperatures in 1961-1970 are compared to the 1931-1960 mean and standard deviation.  (If we used the modern mean, many of the older temperatures would look artificially cold and would boost the counts in earlier years.)


We can see that 2013 really stands out in the "2 SD or more" category, with this year's count exceeding any previously observed for both Fairbanks and Anchorage.  The number of days at least 1 SD from the mean is very high but not unprecedented, while the 3 SD count is a record in Fairbanks but not Anchorage.

Note that my numbers differ slightly from Brian's for 2013, which is probably because the calculation method was slightly different for the 1981-2010 daily means and standard deviations (a smoothing method is required).

It is interesting that the total 83-year count for the "3 SD or more" category is much higher for Anchorage than Fairbanks (87 versus 39).  If the daily temperature anomalies truly followed a normal distribution, the counts would be around 48.  This suggests that the Jan 1 - Aug 2 Anchorage temperature distribution might have "fat tails" compared to the normal distribution, i.e. a higher chance of high-sigma events.  But strong decadal variability or long-term trends could also be playing a role - more investigation is required.

Saturday, August 3, 2013

Warm Spells and Cold Spells in Fairbanks

I have thought a lot about what constitutes a cold spell or a warm spell over the years. We have all heard countless times something close to, "what a nice stretch of weather we have had" or "it's been really cold for the last two weeks." Based on a cursory review of the literature, there is nothing even approaching a definition of where to put the bounds on a homogeneous grouping of days. So how do we quantify something that is inherently ambiguous. We can all agree that if the temperature is 2 standard deviations above the mean for 15 straight days that that would constitute a warm spell. But what if day 8 (of the 15 days) was cloudy and wet and was 0.1 standard deviations below the mean; leaving 14 of the 15 days 2 standard deviations above the mean. Is the 15-day period a single warm spell with one outlier or is it two distinct warm periods? What I have temporarily proposed is that if 6 out of a group of 7 days are in the upper third (tercile) of the expected temperature range, each of those days is a member of a warm spell. Conversely, if 6 out of a group of 7 days are in the lower third (tercile) of the expected temperature range, each of those days is a member of a cold spell. This is an entirely subjective criteria and I am very interested in suggestions from the readers for an alternative criteria. I discussed this with Rick a few months ago and he chimed in with a few thoughts so he is off the hook (for the time being). The first graphic below shows standard anomalies for Fairbanks during May 2013. The cold spell at the beginning of the month and the warm spell at the end of the month are identified. Make note of the text on the graphic that explains why certain observations are included in the respective groupings. Also, there is usually a transition period between one spell and the next but the example below does not have such a transition period.


The next chart shows the length of cold spells in Fairbanks since 1920 using the methodology described above. The typical length of a cold spell is 13.5 days and has been nearly steady over the last 90 years. However, the time interval between cold spells has not always been steady.


Here is the companion chart for warm spells in Fairbanks. The length of warm spells has increased from 13 days to 14 days over the last 90 years. However, as with cold spells, the interval between warm spells has not been uniform.


The final chart shows the number of days per year that Fairbanks has been in a cold spell (blue), a warm spell (red), and the combined number of days (black dashed).


As stated earlier, I am interested in hearing the thoughts of others on the criteria described in the introductory paragraph.

Fairbanks Temperature Updates

Here's some updated Fairbanks temperature and anomaly plots to compliment Brian's post Friday. First, the plot of the daily mean temperature reflected around the 1981-2010 normal:


The sustained, though not monolithic warm weather since late May is evident. Next is the raw daily departure from normal (and for good measure the year to date running departure):


As we all know, absolute temperature departures from normal are much smaller in the summer than in the snow cover season. So, of course I have to include a standardized departure plot, which accounts for the much smaller temperature variability in the summer.

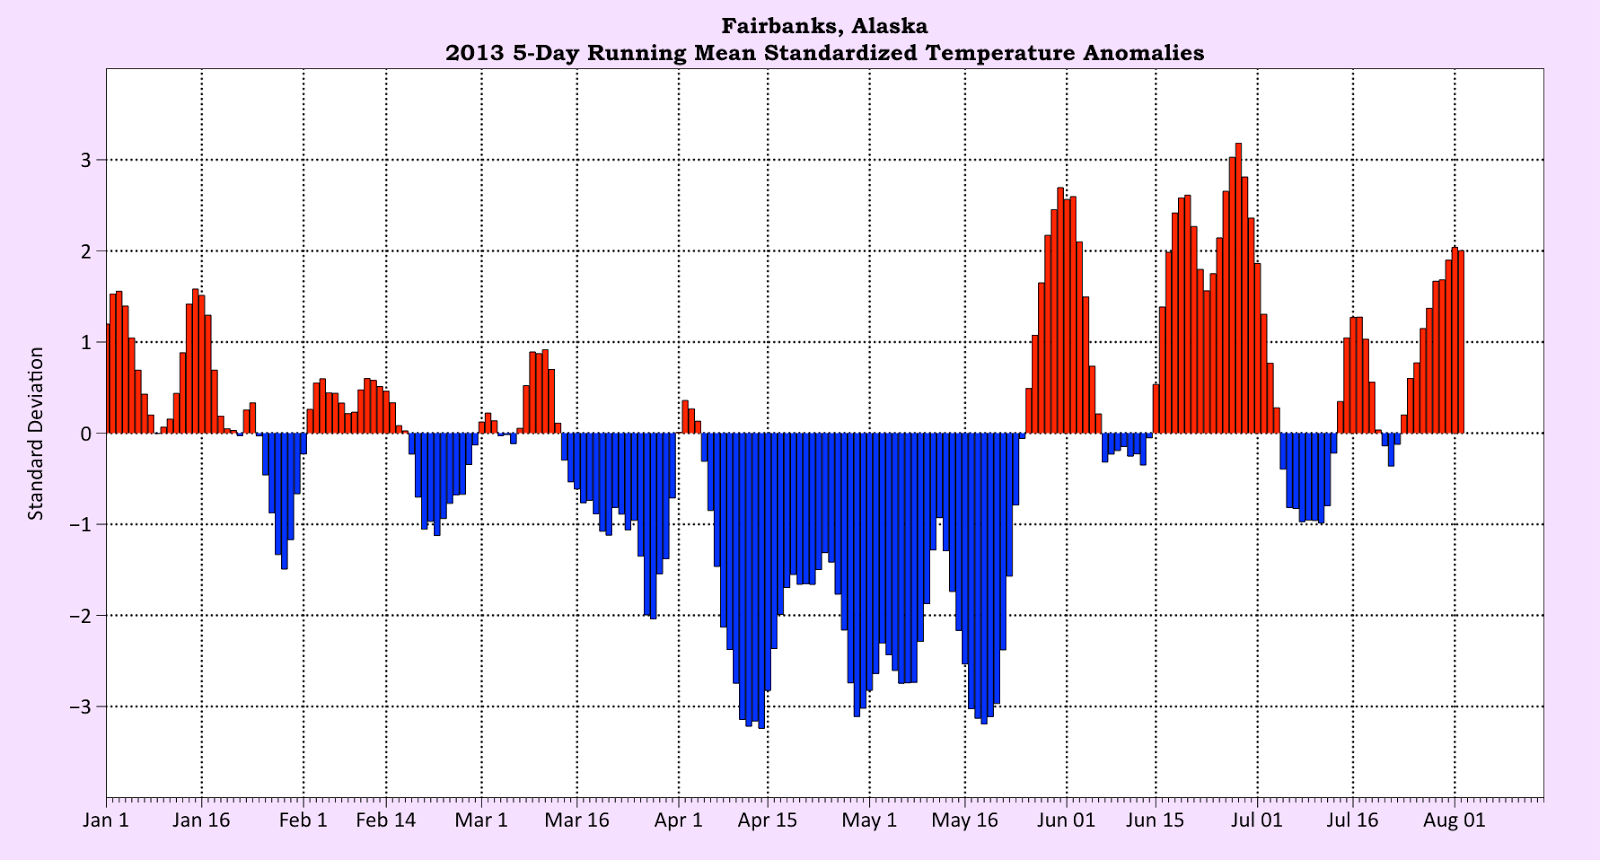
This is the five-day running standardized departure, which smooths the day to day variation and clearly illustrates that we've had a lot of unusual weather since late March.

Friday, August 2, 2013

Year to Date Temperature Anomalies

So far the temperatures in 2013 have run hot and cold both literally and metaphorically. Through August 2nd there have been 214 calendar days for which daily temperature anomalies can be evaluated. The chart below categorizes the daily temperature anomalies for the three main population centers in Alaska by standard deviations from the mean. An expected value, based on the normal distribution, is also shown for each category. What really stands out is how many days both Anchorage and Fairbanks were more than on standard deviation from the mean and how many days all three cities were more than two standard deviations from the mean.

Note: So far this year Fairbanks is 1.4 degrees below normal, Anchorage is 0.6 above normal, and Juneau is 0.4 degrees above normal.


July anomalies

Below are a couple of maps showing the July temperature and precipitation anomalies at observing locations across Alaska.  The format was inspired by Rick's practice of comparing anomalies to the width of the local historical distribution; this allows a more meaningful comparison between locations with widely differing climates.

In the first map (temperature), the area of each circle shows the magnitude of the standardized anomaly, which is calculated as (July mean - 1981-2010 mean)/(1981-2010 standard deviation).  The second map (precipitation) depicts the significance of the precipitation anomaly by using the rank of the July total compared to the 30 July totals in the 1981-2010 period; so the largest possible circle is obtained when the July total is either smaller or larger than any in the 30-year period.  If the July total falls in the middle of the historical distribution, the circle has zero radius (i.e. precipitation was close to average).

The numbers at the observing locations show the actual values for the mean temperature and total precipitation.


Thursday, August 1, 2013

Sunshine Duration Through the Year

The sun sets at Barrow on Friday morning, August 2nd at 157am AKDT for the first time since early May. So here's a plot of possible sunshine (duration the sun is above the horizon) through the year for some representative Alaska location:
I've include 18 months to get the full effect of month the winter minimum and summer maximums.

Why So Warm?

Reader Gary asked about the cause of the warm summer in much of Alaska and pointed to the upper-atmosphere flow pattern as an explanation.  In a certain sense this is undoubtedly correct, because observed weather patterns at the earth's surface are always closely related to the configuration of the air flow at various heights in the atmosphere.  This summer has seen unusually strong upper-level high pressure across Alaska, especially in the south.

Looking at a few maps, the first chart below shows the average (1981-2010) 700 mb height field in June and July, which can be thought of as the pressure pattern at about 3 km or 10,000 feet above sea level; there is a mean trough in the Bering Sea and extending into the Gulf of Alaska, and a ridge extending up from British Columbia to eastern Alaska.
Now let's look at the average 700 mb height this summer so far (since June 1), see below.  Heights have been much higher than normal over most of Alaska, as the southeastern ridge has been very strong and the Bering Sea trough has been weak.
Taking the difference between this year's average and the long-term mean shows where the height has been most unusual, see below.
What does this all mean?  Two things, as I see it: first, the source region of the air over southern and interior Alaska has been predominantly far to the south, so that the prevailing air mass has been very warm.  Chilly Arctic air has stayed out of the picture, because the strong ridge has kept cold fronts well to the north and west.  Second, the ridge has caused subsidence and low humidity in the lower atmosphere, leading to plentiful sunshine and dry conditions, which in turn favors higher temperatures.  Thunderstorms have been scarce because the atmosphere has been stable.

Having said all this, in my view the upper-air flow pattern is ultimately unsatisfying as an explanation for the warm weather, because the question immediately turns to "what caused the ridge"?  Why did the weather pattern evolve this way in the summer of 2013?  This is an enormously difficult question, and I only have one small piece of possible insight to offer: this summer's pattern may (perhaps) be (partially) related to the phase of the Quasi-Biennial Oscillation (QBO).  The QBO is a fairly regular cycle in east-west winds in the tropical stratosphere, i.e. about 15-50 km above sea level at the equator.  Over a period of about 2-3 years, the wind direction reverses from east to west and back again, and it is known that the phase of the oscillation affects weather and climate variations around the globe.  This summer there happens to be a strongly positive phase of the QBO, so I looked up previous years with similar phase and found the following pattern of 700 mb heights near Alaska:


The map shows that higher heights are more common from the Bering Sea to southeast Alaska when the QBO phase is significantly positive in summer.  So it's possible that the QBO phase this summer raised the likelihood of a strong ridge developing over Alaska, although it certainly cannot be cited as the only reason.  Note that several of the top QBO years listed on the map brought cool summers in Fairbanks (e.g. 2008, 2002, 2006), so it is far from a one-to-one correlation.  Also, I can't comment on the exact mechanism by which the QBO might influence the flow pattern near Alaska - it's purely a historical observation and may be a coincidence.

Rick and Brian may have more to add on causes of the warm summer - and any other insight or suggestions from readers would be most welcome.

Tuesday, July 30, 2013

Record Warm Spell for Anchorage

* Updated 7/31

Much as already been made regarding the breaking of the record for consecutive 70-degree days for Anchorage. Today is day number 14 in a row and the forecast for the next several days indicates that the record will be extended. What has not been noted anywhere is that the last two weeks has been the warmest two week period ever measured in Anchorage when looking at the average daily temperature. Here is the list:

14-Day Ave Temp            Date Range              Rank
          64.96             7/17/2013 - 7/30/2013      1 * (minor edit on 7/31)
          64.89             7/7/2003 - 7/20/2003        2
          64.82             6/20/1953 - 7/3/1953        3
          64.75             7/18/1936 - 7/31/1936      4

In addition, Anchorage (and Fairbanks) are closing in on their warmest summer-to-date records. Here is an update of the chart uploaded a few days ago.


Note: Each of the thin lines represents the cumulative average temperature for the summer season at a specific point in the season for the 10 warmest summers on record. Here is an example of how it works.

Date            Temperature       Season-to-Date Temp.     Calculation
June 1               66                              66.0                       66 / 1
June 2               62                              64.0                       (66+62) / 2
June 3               71                              66.3                       (66+62+71) / 3
June 4               67                              66.5                       (66+62+71+67) / 4
June 5               65                              66.2                       (66+62+71+67+65) / 5

At the beginning of the summer there is a lot of variation since the value in the denominator is small. Over the course of the summer the lines tend to converge.


Monday, July 29, 2013

North Slope Cold Front

It's a raw summer day in Barrow with drizzle, mist, 34 °F, and winds gusting to 30 mph.  The UAF webcam reveals bits and pieces of sea ice along the beach.


A strong cold front went through yesterday just after midday, bringing a sharp temperature drop after late-morning warmth of near 60 °F.  In advance of the front, a substantial amount of rain accompanied the warm, moist airmass: the daily precipitation total of 0.55" and the two-day total of 0.70" are the highest respective precipitation amounts in Barrow in over three years.

Today's pocket of cold air is apparent in the following time-height temperature cross-section for Barrow, which shows a computer forecast for the lower atmosphere beginning at 10 am ADT yesterday; time increases to the right and the vertical axis is pressure in mb.  Surface temperatures near or a little below freezing are possible for the rest of today and into tonight.


Saturday, July 27, 2013

Summer-to-Date Temperatures

Through July 27th, both Fairbanks and Anchorage are well on their way to Top 5 warmest summers on record. As is stands now, Fairbanks is in 4th place with a season-to-date temperature of 65.3F. In first place is the questionable summer of 1915 with 1975 and 2004 close behind – each of those years is approximately a full degree ahead of 2013. For Anchorage, the season-to-date temperature of 59.95F is only 0.2F below the record pace of 2004. The chart below shows the Top 10 warmest summers for each city with the running mean of June 1st through August 31st. The 2013, and 1981-2010 normals are shown and thick solid and thick dashed lines respectively.


Arctic Sea Ice Update

There is much more ice in the Beaufort Sea presently (July 27th) than last year at this time. Here's the Alaska-centered graphic from the University of Illinois Cyrosphere Today:

The  difference in the Beaufort Sea coverage between last year and this year is shown at the endpoints of this plot:
Arctic-wide, the sea ice coverage is not quite as low as the record low last year, but it is close, thanks to much less ice on the Atlantic side of the Arctic. This year continues the pattern we've seen since 2007, with different parts of the Arctic having different year to year melt patterns, but for the basin as a whole the ice coverage continues to decrease. The melt season has another six to nine weeks to go, and a vigorous storm earlier this week well north of Alaska may have broken up a lot of northern Beaufort Sea ice, so the accelerating decline evident on the Beaufort Sea ice area plot is likely to continue.

Friday, July 26, 2013

Kenai Rainfal

Last night just before midnight AKDT, the Kenai Municipal Airport recorded 1.23" of rain in one hour (and 1.83" in two hours). This is an extraordinary amount. To put it into perspective, according to the newly released NOAA precipitation atlas for Alaska (http://hdsc.nws.noaa.gov/hdsc/pfds/pfds_map_ak.html), an hourly reading of 1.17" has a 1/1,000 chance of occurring in any given year for the city of Kenai (1,000-year recurrence interval). The 1,000-year recurrence interval for a two hour rainfall is 1.48". Wow! One of the resources that NOAA used to generate their numbers can be found at the following link: ftp://hdsc.nws.noaa.gov/pub/hdsc/data/ak/dur01h_ams_na14v7.txt . According to that rather abbreviated list, here is a list of the top 1-hour rainfall events in Alaska (I accidentally deleted the date column, sorry):

Station Hourly Rain (in.)
80-1940 PREACHER        , AK   1.67
50-6586 NORTHWAY AP     , AK   1.48
80-2440 TELIDA  , AK   1.33
80-0100 ALCAN HWY   1.32
80-2440 TELIDA  , AK   1.32
50-0352 ANNETTE ISLAND AP       , AK   1.22
80-0460 CHATANIKA       , AK   1.22
80-2620 VUNZIK LAKE     , AK   1.21
50-9941 YAKUTAT STATE AP        , AK   1.20
80-1280 KAIYUH  , AK   1.20

Chilly Morning at Eagle

A quick update to note the overnight minimum temperature of 34 °F at Eagle airport; this breaks the daily record of 36 ° set in 1958 and 1968.  However, most of Eagle's daily record minima in late July are 34 ° or lower, so this morning's chill is not all that unusual.  In 2005 the temperature dropped to 29 ° on July 21 and 30 ° on July 31.

Reader Gary asked about a 2013 precipitation chart, so here it is for Fairbanks.


Peak Precipitation

The resurgence of warm, dry weather over interior Alaska as August approaches is somewhat uncharacteristic for the time of year, as it is more typical to see wetter weather as summer advances.  Indeed the mean annual distribution of precipitation in northern and interior Alaska peaks in late summer, just a few weeks after the seasonal peak in temperature.  At interior locations, the tendency for greater cloudiness and more frequent rainfall is a major reason for the marked decline in average temperature in August; unlike most low- and mid-latitude Northern Hemisphere locations, August is considerably cooler than both June and July in the Alaskan interior.  More frequent rainfall tends to keep daytime temperatures lower, and the greater cloudiness and diminishing solar elevation and length of day combine to significantly reduce the solar insolation.

The charts below illustrate the mean annual cycle of precipitation for six observing stations in interior or northern Alaska; the first shows the mean total precipitation by month, and the second shows the mean frequency of measurable (0.01 inches or more) precipitation by month.  The amount of precipitation peaks in August for all six stations, and August is also the time of peak frequency of precipitation, except for Barrow where precipitation frequency peaks in October.  It is interesting to note that Fairbanks shows a sharper decline in precipitation amount and precipitation frequency from August to September than the rest of the stations, indicating a marked change to drier conditions in September.  The average daily precipitation amount peaks on about July 30 in Fairbanks, but the peak occurs in mid-August for the other locations.


Looking more closely at Fairbanks, the next chart shows the mean daily distribution of precipitation frequency and amount around the year.  The seasonal peaks are quite pronounced, with minimum precipitation falling in April and the maximum occurring only three and a half months later.  The secondary peak in precipitation frequency in October is interesting and may reflect a period of disturbed weather that tends to accompany the precipitous mid-autumn decline in temperature.


Thursday, July 25, 2013

Low Lightning

Reader Gary noted that there has been very little thunder in Fairbanks-land this summer. Fairbanks Airport has had thunder just ine day, and even here on Keystone Ridge I've heard thunder just once. Here is the plot of lightning strikes from the Alaska Fire Service for the two weeks from July 10 through July 24.


The total of 552 would be lackluster for any one day, much less for two weeks in July. Unfortunately, the strike counts this year (and going forward) are not really comparable to previous years data due to significant changes in the AFS lightning detection system. The new system is much more sensitive that the previous system, going so far as to detect separate branches off of the same leader stroke. Additionally, there were numerous technical glitches earlier this summer that made the data suspect.

The two systems were run in parallel for part of last summer, and while there was considerable day to day variation, the new system is counting something like 1.5 times as many strikes as the old system.

Tuesday, July 23, 2013

All-Time Maximum Temperatures

In June, a number of cities in Alaska set all-time maximum temperature records; including: Talkeetna, Valdez, Yakutat, Unalakleet, and many others. Missing from that list were the two largest cities in Alaska. However, it turns out that several of the stations in and around Anchorage and Fairbanks did indeed set all-time station maximum temperatures. In Anchorage, the temperature at Merrill Field reached 87 degrees Fahrenheit which broke their all-time record. Of the four sites that have been the official climate location for Anchorage (Park Strip, Merrill Field, Anchorage International Airport, and the NWS Forecast Office), no higher temperature has ever been recorded. Similarly, a number of the stations in and around Fairbanks set their all-time daily maximums this June. The map below shows the station maximums for both Anchorage and Fairbanks. Readings that have a data quality "flag" have been excluded (Note: The 99 at the Experiment Station in Fairbanks, while highly dubious, is still in the record books). Even though neither city technically broke their all-time daily maximum temperature at their respective climate recording sites, an argument can be made that they each experienced their hottest day on record (6/18/13 for Anchorage and 6/26/13 for Fairbanks).
 

Monday, July 22, 2013

Spring-Summer Temperature Transition

Author: Richard J.  I'm very grateful for the opportunity to contribute to this blog - thanks Rick!  When I stumbled across the site last year, I was delighted to read Rick's insights and commentary, and to begin engaging in some very interesting discussions of Alaska weather and climate.  As a non-resident of Alaska, I can't make any claim to expert local knowledge on the subject, but I hope my contributions will be worthwhile and interesting nonetheless.

For a first post, I thought I would highlight the extraordinary jump from unusually cold spring conditions to unusually warm summer conditions in Fairbanks this year.  I imagine the pace of change might have been dizzying even for locals used to extreme weather variations.  In a "typical" year (which rarely exists, of course), the average temperature would increase by about 21° F from the "spring" average (which I'm calling April and May) to early-mid summer (June 1 - July 15).  This year the temperature increase was over 34° F, and by far the highest in the Weather Bureau/NWS era (1930-present).  The chart below shows the annual values, and 2013 really stands out; the previous record increase was 28.5° F in 1986.


The 2013 change is especially unusual in light of 2010-2012, which saw a much more gentle transition from spring to summer.  The seasonal temperature increase in 2010 was the smallest in the record, only 14.2° F.

The remarkable change this year was created by the sequence of the coldest April-May period on record in Fairbanks (except for 1911), followed by one of the warmest early summer periods on record.  Among the unusual events was the latest first day with mean daily temperature above freezing (April 24), and then less than two months later there were 6 consecutive days with a high temperature of 86°F or above (June 15-20) which has only happened once before in 1918.

So in summary, the swing from one temperature extreme to the other since spring in Fairbanks has no precedent in the modern era.  From a meteorological standpoint, the reversal in extremes seems to be related to persistent high-latitude blocking around the northern hemisphere, which has created many persistent and extreme anomalies in different locations.  Another factor seems to be the evolution of sea surface temperatures in the North Pacific in recent months, which seem to have favored cold in the spring and warmth in the summer.  But that's a subject for another post...

Sunday, July 21, 2013

The Warmest Daily Minimum Temperature in Alaska

Continuing the discussion that Brain's post and thread in the comments about the warmest minimum, the Brian neatly disposed of most of the contenders for 70ºF or higher. The one data point still standing was the University Experiment station on July 11, 1983.

Richard pointed out the min of 70ºF is at observations with both the minimum at Fairbanks International and College Observatory; at the time the College Observatory obs site was less than a mile and about 150' higher elevation.


However, an examination of the original observation form for the Experimental Station shows that the observation day low for July 11, 1983 should have been at least 65, as this was the temperature at the time of observation on the 10th (this should have been caught by NCDC at the time but was not). 

So, if I understand Brian correctly, this means that there are no plausible observation in the GHCN database with daily min temperatures in Alaska of.70ºF or higher What about non-NCDC type data?

The June 1991 heatwave  produced several very warm nights. The highest calendar day minimum I can find is from the Cottonwood RAWS, located on a ridge north of the Yukon River (my memory is that it has been moved to its current location sometime after 1991 but I can't seem to  find online documentation of that). On June 21, 1991 the lowest hourly temperature was 70ºF at 3am and 4am, However, RAWS platforms, then or now, do not record absolute temperature extremes: all we have to go on are the hourly observation. Offhand, I can't think of any why to query the RAWS archive (or SNOTELs) to get at the highest daily minimum temperature. 

So, we're left with the low of 70ºF on June 25, 1992 at Fairbanks Airport as the only "continuously monitored" daily minimum temperature  of 70ºF or higher.  How does this compare with cooperative observations that day?

For June 25th minimum temperatures. we have
University Experimental Station 66ºF
Fairbanks Midtown 64ºF
Fairbanks Airport Upper Air: 58ºF
College Observatory: 58ºF

So this proves that the Fairbanks Airport data is bogus, right? Ahh, no. The hourly observations from the ASOS show 6-12 mph winds every hour from 10pm to 6am, which kept the air at the ASOS well mixed. The joy of mirco-meteorology.

Saturday, July 20, 2013

Maximum Minimums

Rick, thank you for the opportunity to contribute to your blog. Following the posts have been extremely educational as my focus is usually a little farther south. That being said, I would like to note the unusual low temperature that occurred recently. On Friday the low temperature in Anchorage was 61 degrees. This is the highest value on record for the station (Anchorage Forecast Office); although their period of record is only 15 years. The highest official reading for Anchorage was the 63 degree reading at Merrill Field in June 1953. Friday's 61 degree reading goes into the record books as the second warmest minimum temperature on record. Here is the list of the warmest low temperatures at the official Anchorage climate site:

1) 6/27/1953 63
2) 7/19/2013 61
3) 7/15/2003 61
4) 8/4/1999 61  
5) 8/15/1967 61
6) 6/26/1953 61

Pouring through the data generously provided by NCDC, the variability of low temperatures around a relatively small geographical area can be displayed cartographically. The two images below show the highest minimum temperature recorded for the stations around both Anchorage and Fairbanks. The length of record for stations varies tremendously. For Fairbanks, only stations with 10+ years of readings were included. For Anchorage, only station with 5+ years were used. As mentioned earlier, the 61 degree temperature for Anchorage Forecast Office is a station record and the 70 degree temperature for Fairbanks measured on June 25th is also a station record.


Blog Changes

Some changes are in the works for Deep Cold the blog as I've struggled to make time to gin up posts.

To help out with that, a couple of folks with expertise and interest in Alaska weather and climate have agreed to volunteer as Deep Cold post authors. Dr. Brian B. is a long time Anchorage resident with a PhD in Environmental Geography. Dr. Richard J. is a lower-48 consulting meteorologist with expertise in numerical weather modeling and weather risk management.  His travels to Alaska have inspired an avid interest in far northern weather and climate.  The geographic scope of the blog will be increased a bit, with more posts about Alaska weather and climate south of the Alaska Range and probably other high latitudes (roughly north of 60N) areas too.

There are many weather and climate blogs online, so I hope this experiment fills a niche and  keeps quality information on Alaska weather and climate available.

Rick


Wednesday, July 17, 2013

Getting Drier

The lack of rainfall in Fairbanks-land is adding up, so to speak. At the Airport only 0.98" of precipitation fell May first through July 15th. This is the third lowest total of record for this period, behind 1957 (0.63") and 1991 (0.94") and only 33% of the 1981-2010 normal. Here's a plot of difference from the long term (1915-2013) mean for this period for each season since 1915:

Precipitation elsewhere in the area is not much better. Here on Keystone Ridge there's been 2.29" in the same period, a paltry 44% of normal. In the upper Chena Basin, the Munson Ridge SNOTEL south of Chena Hot Springs, at 3100" MSL has measured just 3.2" precip since May 1, just 48% of normal.

Sunday, July 14, 2013

Updated Fairbanks Temperatures


Here's a plot of daily mean temperatures for 2013 (thru Saturday) referenced around normal. Note that the cool spell earlier this month only barely nicked below the one standard deviation "typical temperatures" range. 

This is a bit of a placeholder as I'm trying to decide if I should continue this blog. With my new (since April) job I get a lot of this kind of thing, and it's a requirement that I keep this and work separate. Plus the "burn-out" factor.

Friday, July 5, 2013

The Apex of Climatological Warmth at Fairbanks

Here in the land of the continental climate, mean annual temperatures are now at their peak, just two weeks after summer solstice. Here's a plot of the NCDC 1981-2010 normal daily mean temperature for June and July at Fairbanks:

The slower decline after the peak in early July is due to increased cloud cover, higher dew points and higher soil temperatures in late July than early June. This results in normal low temperatures falling more slowly than normal high temperatures (so the mean diurnal range is less).

Wednesday, July 3, 2013

Warmest Fairbanks Weeks

Here's my take:

The  Weather Bureau/NWS era (1930-present) records are:

Warmest 7-day average maximum temperature (none overlapping weeks):
  1. 87.9ºF June 20-26, 1991 & June 30-July 6, 1986
  2. 87.4ºF June 14-20, 1969
  3. 87.0ºF June 30-July 6, 1990
  4. 86.7ºF July 24-30, 1954
  5. 86.4ºF July 12-18, 1993
  6.  86.1ºF July 19-25, 1968
Warmest 7-day average minimum temperature (none overlapping weeks):
  1. 65.0ºF June 24-30, 2013
  2. 62.0ºF July 11-17, 1975
  3. 61.7ºF June 21-27, 1991
  4. 61.1ºF July 4-10, 1975
  5. 61.0ºF July 18-24, 1975
  6. 60.9ºF June 25-July 1, 1983
The anomalies nature of the low temperatures in late June really stands out. Only 1.1ºF separate #2 from #6, while with high temperatures less than two degrees separate the top six.

The pre-Weather Bureau data from the Agricultural Farm (now called University Experimental Station) is plagued by data quality issues. There is zero doubt in my mind that the weekly average of 90.1ºF July 26-August 1, 1919 is bogus. No other location in Interior even had one day with a high of 90ºF, and this includes Nenana and Salcha. The average of 88.6ºF July 11-17, 1918 is less obviously bad, but is part of what look to be a host of anomalously warm summer temperatures recorded in 1911-1919 at the Ag Farm.

Tuesday, July 2, 2013

June Weather Factoids

Working on catching up with all the weather while I was gone, so here a few lesser publicized factoids:

  • Thunderstorm at Barrow the evening evening of June 13th is the earliest in the season thunderstorm of record there. Barrow also had the warmest June of record.
  • Umiat RAWS had a high of 90ºF on the 20th, and Sagwon SNOTEL had 85ºF same day.
  • Highest reliable temperature so far is 97ºF at the Amber Lake coop site, southwest of Talkeetna. 
  • Both Nome and Kotzebue tied their all-time record highs, 86ºF and 85ºF respectively.
  • Almost 808,000 acres burned in June; The Lime Hills (201,000 arces) and Moore Creek (160,000 acres) are the largest fires.
    View from Ester Dome Tuesday evening, Courtesy of the FAA

Sunday, June 30, 2013

Warmest Week of record in Fairbanks

Updated for new record
The week ending June 30th is the warmest week of record in Fairbanks. Here are are the top five non-overlapping weeks:

  1. 75.2ºF June 24-30, 2013
  2. 74.7ºF June 20-26, 1991
  3. 73.5ºF July 5-11, 1975
  4. 73.0ºF June 30-July 6, 1990
  5. 72.7ºF June 30-July 6, 1986
Here's the NCAR/NCEP reanalysis of 500 mb heights since Solstice. It's a classic pattern for hot summer weather in Interior Alaska, with the high centered west of Great Slave Lake and ridge extending west into Alaska.

Saturday, June 29, 2013

Warmest Five Days of Record in Fairbanks

For the first time ever, Fairbanks recorded five consecutive days with minimum temperatures of 65ºF or higher (June 24-28). As a result, the five day running mean temperature for this period, 77.1ºF is the highest 5-day mean temperature ever recorded in Fairbanks.

Here's a plot of the daily temperature (and 1981-2010 normals) so far this year:
Here's the daily and 5-day standardized anomalies:
So, the current hot weather is as "anomalous" as the cold weather in the spring, having now exceeded three standard deviations from the 1981-2010 normal, though the duration is not as long (thus far).

Wednesday, June 26, 2013

Warmest Day in the Modern Era in Fairbanks

For the first time in modern history, Fairbanks recorded a low temperature in 70s. The low Tuesday of 70ºF. The only other occurrence of a low in the 70s was on June 26, 1915. There was a thunderstorm that day that produced more than one tenth of an inch of rain, so this observation is, to say the least, questionable. 

The high Tuesday of 92ºF tied the record high for the date. The daily mean on 81ºF is the highest reliable daily mean at Fairbanks of record, exceeding the previous record of 80ºF (high 94, low 66) on July 11, 1975.

Tuesday, June 25, 2013

Near Record Warm Low at Farbanks

The low temperature Monday at the Fairbanks Airport was just 66ºF, thanks to a persistent breeze overnight. This is one of the warmest daily low temperatures of record for Fairbanks. The warmest WB/NWS era daily minimum temperature is 67ºF set in several days in July 1975 and again in June 1991.  The "record" of 76ºF in June 1915 is virtually certain to be in error, as there was a shower that produced more than a tenth of an inch of rain the same day.

Also, I'm back. An eventful couple of weeks I'll try to recap as time allows.

Friday, June 14, 2013

North Slope Heatwave

Temperatures soared into the 60s and 70s on the North Slope Thursday. The high of 66ºF at Barrow was one degree from the record high for June 13th. Other  near coastal sites were in the 60s, with Wainwright at 68ºF and Deadhorse at 61ºF. As you would expect, it was even warmer inland. Atqasuk and the Umiat RAWS reported a high of 75ºF and up at Anaktuvuk Pass the high was 72ºF.

Tuesday, June 11, 2013

Cool June Morning

We're enjoying more than 21 and one half hours of sunshine these days, but temperatures in the usual cool spots dipped to near or just below freezing Tuesday morning. Goldstream Creek and Angel Creek near Chena Hot Springs fell to 31ºF, Gilmore Creek and Mile 42 Steese had 33ºF and the Woodsmoke CWOP reported 35ºF.

I'm on the road the next two weeks so posts likely to be limited.

Saturday, June 8, 2013

Really 1 Below Zero at Anaktuvuk Pass in late June?

Reader Richard asked about the veracity of the low temperature of 1 below reported on Jun 25, 1967 at Anaktuvuk Pass, and he expressed considerable doubt that this could be correct. This would be a state and, says Richard, a national record for June.

Here's the situation: Anaktuvuk is at 68.1N 2100' in the Brooks Range; the village is right on the valley floor and within one mile of the continental divide. On general principles,  it seems to me that it is (barely) within the realm of possibility that IF there was a fresh snow cover and IF an unseasonably cold airmass in place AND skies cleared late evening AND winds were light that Anaktuvuk could get this cold in late June (this would be a lot more believable if it was the first few days of June). 

There are historically very few weather observations from this part of the world, and the data quality from the coop observation at Anaktuvuk during this time have more than a few problems.  Here is the scan of the original form for June 1967:

Courtesy of NCDC
There looks to be no doubt that the value written in was -1, and there is no other evidence on this form that there is some confusion with, say, degrees C. Most of the temperatures during this month look plausible, and while there are different writing implements used, it looks to me that the hand writing is all the same person. That fact that most of the temperatures look okay makes it less likely that observer was reading the wrong end of the min temperature index, which would  make lows about 12ºF too low.

If these are really observations taken at 5pm (and differences from the scheduled time of observation are hardly ever recorded by the observer on the form), the data on the 24th looks suspect: was it really 40F at 5pm on the 23rd, fell to 17F the following morning ( itself a remarkably low temperature for so late in June), then rebounded to 60F, only to be back to 35F by 5pm on the 24th? The high temperature of 44F on the 25th looks plausible.  Notice too the remark concerning snow cover on the morning of the 27th, but nothing that would suggest snow on the ground on the morning of the 25th. 

If we look at what was happening on the broader scale, here's the NCEP/NCARR Mean Sea-Level Pressure and 850mb temperature reanalysis for Jun 25, 1967:

Courtesy of NCEP/NCAR
This does not help settle the question. There is a surface ridge across the Brooks Range and 850mb are slightly below freezing (on this rather course scale). Now 850mb temperatures a little below zero are hardly unusual over the Brooks Range in mid-summer. Cooler than normal, for sure, but nothing extra special. Also, as Richard pointed out, there is nothing of note at other northern Alaska locations around this date.

It would be nice to have some explanation of how the -1F got to recorded, but I can't think of any offhand. So, lacking any additional evidence, my vote is: beyond reasonable doubt, the low temperature was not  -1F at Anaktuvuk Pass on June 25, 1967. However, there IS a very slight chance that the all the ingredients came together and that the observation of -1F is correct.

Not Much Thunder Yet

Courtesy of AFS

The Alaska Fire Service as had some issues with the lightning detection network (both under and over reporting strikes), but there is no doubt it's been a slow start to the convective season in Interior Alaska. The plot on the right plots strikes May 25th through Saturday morning. Here on Keystone Ridge, there has been no thunder heard to date. Only once in the past 17 years have we gone past June 9th without any thunder: that was in 1998, when there was no thunder heard here until June 28th. Of course, it is not uncommon for Fairbanks airport to not have reported thunder by June 8th. The fire expansion has slowed with the wetter weather this week. The total acreage burned as of Saturday morning stands at just under 46,000 acres. More than 60% of that total is from the Doestock Creek fire south of Aniak.

Tuesday, June 4, 2013

Barrow Ice Still in Place

The Barrow ice cam was down for a while over the winter, but it's back and seems like to a good idea to post an image as we head into the melt season. It's not the prettiest day in Barrow, but here's the view Tuesday late afternoon. That's all ice out there.

Courtesy of the UAF Ice Group

Fire Season Takes Off


The cold spring greatly retarded the fire season: as of Friday, May 31 only 665 acres had burned. That changed over the weekend, as the season roared to life: Monday morning Alaska Fire Service was calling 32,600 acres burned. Most of that was in Southwest Alaska, where the Doestock Creek fire, south of Aniak, was over 18000 acres. There were several staff fires southeast of Tok, with the Bitter Creek fire threatening to close the Alaska Highway. Here's the AFS plot of "active fires" from Tuesday early morning, bearing in mind that active means "not declared out" and that many of these are 0.1 acres or less. The lack of fires in the northern Interior reflects the lack of lightning thus far this season.

Saturday, June 1, 2013

Oh What a May It Was

Hard to know how to present all the notable events of May 2013, so when in doubt, put up a chart. Here's a plot of the daily mean temperature at Fairbanks in May.

Only six seven days the entire month were within one standard deviation of normal. On to the highlights:
In the Weather Bureau/NWS era (starting 1930)
  • 10th coldest May
  • Latest date (May 18th) of record with a daily high temperature below 40ºF and daily mean  below freezing
  • Three daily record low temperatures and two record low max temperatures
  • Winter snowpack melt-out of May 11 is the second latest of record
  • 18 days with daily low temperatures of  ≤32ºF is most in May since 1964
  • Green-up of West Chena Ridge as seen from UAF on May 26th is latest since observations began in 1974 and probably latest since 1964
  • The 47 consecutive days with daily mean temperature below normal appears to be a record for such a streak, though it is not a record for consecutive days with departure of the same sign (53 days in a row in autumn 2002 above normal)
  • Lowest April-May of record (mean temperature 31.3ºF)
  • Fourth lowest March-April-May of record (mean temperature 23.2ºF)
On the warm side:
  • Daily record high of 84ºF tied on the 30th
  • Five days with highs in the 80s ties for second greatest such days in May (record is seven days in 2011)
  • First time ever in May with five straight days of highs 82ºF or higher (thanks to reader Brian for this one)