Saturday, May 27, 2023

Follow-Up

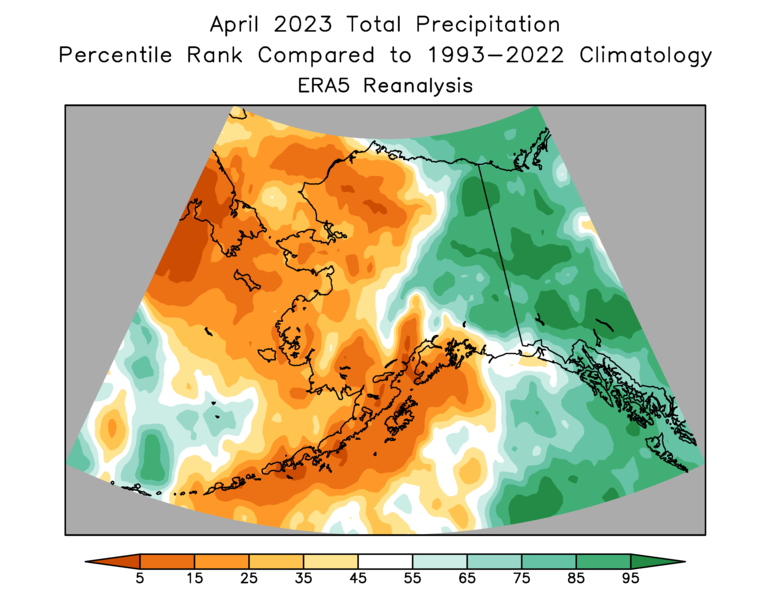
Breakup is nearly complete now to the south of the Arctic Circle, but flooding problems continue on the Yukon River.  Heavy inflows from the Porcupine are keeping water levels very high downstream of Fort Yukon, and far to the southwest ice jam flooding has been a problem all week around Russian Mission and more generally in the Yukon delta region.  Flood warnings are now in effect all the way to the coast at Emmonak and Alakanuk.


Following up a bit more on the relationship between Alaska's fire season and the tropical Pacific, here's a map of June-July sea surface temperature patterns for the top 10 fire seasons since 1979 (all over 2 million acres).


This is interesting because it shows a "central Pacific El Niño" signal, and the eastern equatorial Pacific shows no unusual warmth at all.  A classic El Niño SST pattern would be focused in the eastern tropical Pacific: here's the average anomaly in the top 10 summer El Niño events since 1950.


So the Alaska fire equation is not as simple as El Niño = active fire season.  But we already know that, because prior to 1995 there were plenty of El Niño events without notably enhanced Alaskan wildfire.  Here's the average anomaly in those years (June-July El Niño between 1979 and 1995):


The obvious difference here is that both the northwestern and northeastern Pacific were cooler in those years; and of course some of the pre-1995 El Niño events were quite weak.

Now what about last year?  La Niña was entrenched in 2022, with plenty of cool water in both the central and eastern equatorial Pacific, but the North Pacific had much more widespread and unusual warmth than is typical for a strong La Niña.  The second map below shows the average SST anomaly for the top 10 summer La Niña events since 1950.


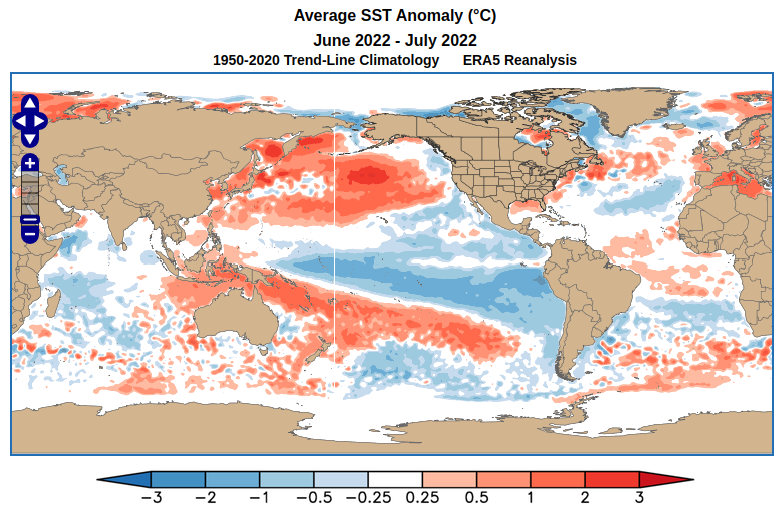
So if I had to guess, last year's active fire season had a lot to do with the warm North Pacific, especially in the western Bering Sea and south of the Aleutians.  A warm North Pacific is clearly associated with higher fire activity, as in the first SST map above.

As for this year, while we do have El Niño emerging, it's very much focused in the eastern Pacific, with no unusual warmth yet in the central tropical Pacific.  There's also much less warmth in the western Bering Sea than last year; so it seems the pattern is not particularly well aligned with a typical active fire season pattern.  However, SST anomalies can change quickly in summer.  It will be fascinating to see how this season plays out.


Sunday, May 21, 2023

Ice and Fire

Extensive breakup-related flooding continues for certain unfortunate locations, including Buckland in the northwest, and along a lengthy portion of the Yukon between Ruby and Tanana.  In the words of the river forecast center, it's a "very dynamic" breakup, with ice being displaced only reluctantly by pressure from backed-up river flows.

Photos from the NWS in the past few days:


Ned Rozell's latest dispatch recounts the dramatic breakup in Eagle last weekend:

https://www.adn.com/alaska-news/science/2023/05/19/when-river-breakup-came-to-eagle/

But while the weather has remained chilly in western Alaska - indeed there was a bit of accumulating snow in Bethel on Tuesday and Wednesday - things are heating up in eastern and southeastern Alaska.  Sitka rose to a remarkable 82°F on Thursday, and Haines reached 80°F, both the earliest on record for such warmth.

Also very remarkable was Fairbanks' daily minimum temperature of 60°F yesterday.  (The overnight low Saturday morning was actually 61°F, but it then reached 60°F by midnight Saturday evening.)  Only one other year has had a low temperature of 60°F in May, and that was on the 25th (in 1960).  Some years don't see a single night that warm over the whole summer, most recently in 2020.  And prior to the mid-1960s it was an unusual occurrence in any year.

It's also been very dry recently in Fairbanks, with only 0.08" of precipitation since mid-April, and zero measurable precipitation so far this month.  If warm and dry weather persist into next month, then wildfire risk will rise quickly.  Western Canada is already having an extremely active and early fire season, with fire acreage already exceeding 5 million acres nationwide.  Of course Canada is a very big place, but for reference that's already on par with Alaska's largest fire seasons on record (2004 holds the record, at 6.6 million acres).

Interestingly, the two coldest Aprils of the last 30 years in Fairbanks were also fairly active fire seasons for Alaska: 2013 (1.3 million acres burned), and 2002 (2.2 million acres).  The modern average (median) is about 600,000 acres or so.

The emerging El Niño in the tropical Pacific is definitely a risk factor for increased fire acreage this summer.  Here's a chart I've shown before, updated to include last year:

Last year was actually a surprise from this perspective, because La Niña was still very much entrenched in the tropical Pacific, and yet Alaska's fire acreage was much above normal.  I'll have more to say on this in a subsequent post.


Tuesday, May 16, 2023

Severe Breakup Flooding

Unfortunately the worst-case scenario for ice jam flooding has occurred for some stretches of the Yukon and Kuskokwim rivers in recent days, as a "dynamic" breakup unfolds following the very cold April.

Flooding and damage has been particularly severe in Circle and Crooked Creek, located on those two rivers respectively.  Apparently the flood was equal to or worse than the record 1945 flood in Circle, and was worse than the benchmark 2011 flood in Crooked Creek.

https://www.adn.com/alaska-news/2023/05/15/record-flooding-destroys-homes-and-prompts-evacuations-in-southwest-and-interior-alaska/

As noted in this article, the risk of serious breakup problems was flagged ahead of time, with the combination of a cold April and deep snow pack being major contributing factors.  Rick Thoman highlighted historical examples of breakup flooding in his latest Substack post:

https://alaskaclimate.substack.com/p/spring-break-up-flooding

Courtesy of UAF's GINA group, here's a satellite-estimated view of severe flooding downstream of Circle on Sunday, after the breakup front moved downstream from the village.


Here are some NWS photos of the aftermath:


And Crooked Creek:


With very cold Aprils occurring with surprising frequency in recent decades, it seems that ice jam flooding will unfortunately remain a big problem for communities along Alaska's largest rivers for the foreseeable future.


Thursday, May 11, 2023

Still Cold in Kotz

The temperature contrast between western and eastern Alaska can be pretty striking at this time of year, as the interior warms up quickly, but the Bering Sea coast can still be locked in with wintry conditions.  Today is a case in point: Eagle has reached at least 67°F, but it's a breezy, sub-freezing day along parts of the west coast.


Looking more closely at Kotzebue in the northwest, it has been distinctly cold this week, with the morning temperature dropping to 8-10°F on Monday, Tuesday, and Wednesday.  It's been 10 years (2013) since this kind of cold was observed so late in the season, and prior to 2013 we have to go back to 1966 to see colder conditions.  Kotz has yet to see its first daily-mean temperature above freezing this year, and even in earlier decades of the 20th century that would have been unusual at this point on the calendar.

Yesterday afternoon's 500mb map shows the immediate reason for the big west-east contrast: a trough over Alaska's west coast, and a big ridge over western Canada.  The red circle indicates Kotzebue's location:


This pattern is typical for the time of year, as abundant Bering Sea ice produces a major chilling effect compared to the land area to the east.  But this goes beyond the simple matter of the ice acting as a refrigerator.  With snow mostly gone from the continental interior, a tremendous amount of solar energy is absorbed, leading to rapid warming, but the sun is much less effective at warming the reflective snow and ice of the Bering Sea.  And to add insult to injury for the west coast, there's a lot less sunshine to begin with because of that semi-permanent upper-level trough, so cold begets cold in the west.

On another note, here's just one more piece of evidence to show how remarkably cold it was for northwestern Alaska in the first half of April: daily maximum and minimum charts for the CRN site near Selawik.


In the second week of the month, this site saw 6 of 7 days with a low temperature below -30°F, and the temperature didn't rise above 0°F for 8 days straight.  Considering Fairbanks has never seen an April day with a high below 0°F, and Bettles has only seen a handful, this was a remarkable cold spell.


Monday, May 8, 2023

April 2023 vs 2013

First, "breaking" news from Nenana, where the Tanana River went out this afternoon at 4:01pm officially.  May 8 has seen breakup in 8 previous years, but only one (2001) in the last 35 years.  It used to be a very typical date, but it's very much on the late side compared to the normal of recent decades.  Check out Rick Thoman's latest post on the topic, published yesterday:

https://alaskaclimate.substack.com/p/tanana-river-at-nenana-break-up

Second, the NOAA summary data are in for April.  Their verdict: it was the 4th coldest April statewide since 1925, and that's the same ranking as Fairbanks attained from 1930-present.

The order of the years is different otherwise, however: this April was marginally colder than 2013 for Alaska overall, according to NOAA/NCEI, whereas April 2013 was easily the coldest on record in Fairbanks.  Here's the ranking of the two months relative to the last 60 years according to ERA5 reanalysis data:


2013 was significantly colder in the eastern interior and Southeast Alaska, except for the southern panhandle; but 2023 was considerably colder for western Alaska, and especially in the northwest.  The western interior was just a bit colder this year, as evidenced by data from Bettles (11.2°F vs 11.6°F).  The maps above also illustrate that the 2013 anomaly was part of a much larger cold pattern over interior North America, whereas this April's cold was quite localized over Alaska.

The 500mb height maps confirm the different spatial scale of the monthly-mean anomalies in the two years.  Last month saw a localized trough that was perfectly placed to deliver cold to western and interior Alaska, but in 2013 Alaska was on the western edge of a much larger-scale upper-level cold anomaly.


Here are my usual climate rank maps relative to the prior 30 year climate, for April 2023:


Thursday, May 4, 2023

April Trend Statistics

In Monday's post I pointed out the rather striking increase in "cold outliers" for April temperature in Fairbanks, as reflected by the rather large difference between the least-squares trend and the median trend.  I suggested it would be interesting to estimate the statistical significance of that difference, so I went ahead and ran the calculation.

Here's how it works: I take the median trend as a reasonable estimate of the "true" (unknown) trend and then repeatedly re-order the years by shuffling the annual departures from that trend.  Here's a completely synthetic example of what the April history "might have been" if random chance had produced the annual departures in a different order:


This example (chosen for this reason) has the opposite behavior to the real world, with fewer cold outliers in recent decades; the median trend (not shown) is less steep than the least-squares trend.  Here's the real world for comparison:


After shuffling the years 5000 times, here's the histogram of the trend-line differences, with the "true" trend difference noted on the far right.


This shows that the observed difference is very unlikely to have occurred by random chance.  To be precise, only 2.8% of realizations have a trend difference as large (either negative or positive) as the observed difference, so we can conclude that the trend difference is statistically significant at better than the 95% level.

In other words, this particular change in April temperature behavior - the tendency to produce more cold outliers in recent decades - appears to be a "real" climate change and is unlikely to be just random chance.

Interestingly, however, if we exclude 2023 from the calculation, then the smaller trend difference is much less significant: nearly 10% of shuffled realizations match the 1930-2022 difference.  So it's only with this year's outcome that the statistically significant signal has emerged.

Again, to restate: this April's cold outcome makes it much more likely that we're looking at a "real" climate change, not a random/chance sequence of events.

Finally, I tested the sensitivity to using the least-squares trend instead of the median trend as the baseline ("true") trend for anchoring the data series, and the results are similar: only 3.4% of realizations exceed the observed trend difference.

Monday, May 1, 2023

Fairbanks April Temperatures

April is in the books, with a monthly mean temperature of 21.5°F in Fairbanks, and that's the 4th coldest since 1930.  The last few days of the month were positively springlike with the temperature reaching 54°F only 6 days after the record cold high temperature of 17°F on the 23rd.  A big turn-around is not at all unusual when there's an amplified pattern that lends itself to temperature extremes.  (But even with the big warm-up, daily mean temperatures didn't rise above normal - only the 2nd and the 4th of the month were warmer than normal.)

The long-term chart of April mean temperatures in Fairbanks is interesting:


The thing that jumps out at me here is the skewed distribution after about 1985, with most years seeing April temperatures above 30°F, but a minority being much colder.  Prior to about 1985, the distribution looks much more symmetric.

Another striking aspect is that 8 of the 10 warmest Aprils occurred from 1983 to the present, but the 10 coldest Aprils are distributed quite evenly across the history.  Even though the climate has warmed a lot, the chance of a significantly cold April (say below 23°F, -5°C) doesn't seem to have decreased.

We can make simple estimates of the change in the mean versus the median by using linear regression in the first case and quantile regression in the second.  Here's the result:

Both trend lines have increased, but the median trend has risen nearly twice as fast as the mean trend.  It would be interesting to rearrange the data many times and see how often this difference occurs by random chance - my guess is not very often, suggesting that there's been a "real" change of climate behavior, and this isn't just a random feature of (say) normally distributed data.

What might account for this?  The only possible explanation I can think of is that it might be related to increasingly pronounced and persistent disruptions of the high-latitude circulation in connection with stratospheric polar vortex disruptions in mid/late winter; and perhaps this is being forced by pronounced warming trends in the western tropical Pacific.  We had a stratospheric vortex disruption ("sudden stratospheric warming") back in February, and I think it bears some responsibility for the April cold in Alaska; and there was also one in 2013 that seemingly had a connection.  These events don't happen every year, they are all different, and there's scientific debate over the long-term trends; but that's the only speculation I have at this point.