Tuesday, November 29, 2016

Low-Elevation Sunshine

Colder than normal conditions have settled over the interior, and so far the RAWS thermometers at Norutak Lake and at Prospect Creek/Jim River have measured the coldest conditions: -45°F this morning.  A report of -49°F from the Bettles SNOTEL site seems suspect as that site always runs cold.

Norutak Lake is located just north of the Arctic Circle and just to the east of the upper Kobuk River where it drains south out of the Brooks Range.


It is interesting to note that yesterday's hourly temperature observations from Norutak Lake showed a rise of 8°F in association with some very weak solar radiation during the day (see below).


The sun only rose to an elevation of 2° above the horizon yesterday at Norutak Lake, so I wouldn't have expected to see such a large diurnal temperature change.  However, a closer look at the topographic map reveals that the RAWS site is located on a south-facing slope at the north side of the lake.  The RAWS elevation is given as 800', but Norutak Lake itself is at 712', so the thermometer is almost 100' above lake level.  It seems that the south-facing exposure allowed for a bit more solar heating than would occur at lake level, and the daytime warming may even reflect the warm bias that RAWS thermometers are known to encounter on calm, sunny days.

With a surface-based temperature inversion undoubtedly in place over Norutak Lake, it's likely that temperatures near the lake surface were at least a couple of degrees lower than at the RAWS site, and perhaps substantially lower.  At Fairbanks airport it is normal to see an inversion of 4-5°F per 100 feet at the surface during winter, and 10°F per 100 feet is not uncommon.

Saturday, November 26, 2016

Deepening Cold

Temperatures below -30°F have been observed in a number of interior locations in the past week, and it seems it won't be long before -40° cold arrives in some areas.  [Update Sunday: the Norutak Lake RAWS recorded -40° this morning.]  The latest GFS MOS forecast shows -45°F for Arctic Village on Tuesday and -26°F in Fairbanks.  Here's a chart of the lowest temperatures observed each day across Alaska in the past couple of months.  The Chalkyitsik RAWS site was the location of the coldest temperature report on 17 of the 57 days shown here, although some of these were ties.  The next most frequent cold spot (7 days) has been Chicken.


In a change of scene for Fairbanks, below-normal daily mean temperatures occurred for 7 consecutive days ending Thursday, the first such period since mid-July.  It's gratifying to see that my earlier speculation of a turn to colder conditions around November 19-21 worked out well - as we all know, even a blind squirrel finds a nut occasionally.


Looking again at the MJO phase, it's interesting to note that colder conditions tend to occur about 10 days after phase 7 even when the PDO phase is positive (as it is now) - see the graphic below.  (But note that the sample size is quite small for this analysis.)  Unusual warmth is much more likely to develop soon after an active MJO wave progresses through phases 1-3, which is where the MJO has been in the past week (second image below).  We might therefore expect warmth to return to Fairbanks rather soon, although the MJO anomaly is now fading and predictability may be lessened as a result.  In any case, the tropical MJO wave is only one of many influences on sub-seasonal climate variability in Alaska, so we wouldn't want to rely too heavily on it.


Wednesday, November 23, 2016

Low Snowfall Winters

As a long time reader and life time weather enthusiast I've been invited to share some of my observations about weather in our great state of Alaska.  I'm sure not going to surprise anyone when I say that this winter has been shaping up as a dry one. In fact the Fairbanks airport is reporting a snow pack depth of only 2 inches from a total of 4.1 fallen inches .  Normally we'd see about 2 feet of measured snow by now. Indeed Fairbanks has only received 0.26" of liquid equivalent since October 1st.

I suspected that low snow years may correlate with persistent southerly steering flow. After talking with Richard James he suggested I look at 700 mb level wind direction. I reviewed wind data from 2000-2016 during the winter period of each year (Oct 1st-April 1st). I found that when winds are coming from almost due south (180 degrees) Fairbanks had low snow years.


No surprise the Alaska Range is real good at blocking out moisture from the Pacific. So for you snow lovers out there; southerly winds are bad.  I should note that there is a small correlation to snowy years when winds are more from the south west and off the Bering sea. I'll expand on this more later. Thanks for reading my first post.  -Mike

High Arctic Warmth and ENSO

The recent very unusual warmth in the Arctic has drawn considerable attention from various quarters, and justifiably so; the conditions have been quite extreme.  Here's an estimate of the temperature anomaly for the week ending November 20, based on NOAA's CFS reanalysis data.  Temperatures have been 15-20°C above even the relatively recent 2001-2010 normal over parts of the Arctic Ocean; but parts of Siberia have endured a correspondingly extreme cold anomaly.


Pressure and temperature analyses over the same period (see below) show that the recent Arctic warmth was connected to a circulation pattern involving low pressure in the Norwegian and Greenland Seas and high pressure over central Russia.  The flow associated with these features transported warm air into the Arctic from far to the south over western Europe and the North Atlantic Ocean.  Therefore an absence of Arctic sea ice is not the only reason for the warm conditions, but of course the mutual reinforcement of open water and warm air helped to amplify the anomaly.


One question that occurred to me is whether the Arctic warm anomaly may be a lingering result of last winter's strong El Niño episode.  Could a warm early winter in the Arctic be an amplified reflection of the jump in global temperatures that always accompanies El Niño?  The chart below shows that the answer is no, and in fact the reverse is true: on average, El Niño tends to be followed in the early part of the next winter by colder November-December conditions in the high Arctic (north of 80°N), whereas La Niña quite reliably brings unusual warmth in the subsequent winter.


The inverse correlation that's evident here is partly caused by twin long-term trends towards less frequent El Niño conditions and warmer Arctic conditions in recent years, as seen in the chart below.  In other words, recent years have been warmer and have also seen a preference for La Niña conditions, and this by itself explains part of the inverse correlation.


Nevertheless, a fairly robust correlation remains after removing the long-term trends - see below.  It's interesting, however, that the two strongest El Niño's (1982-83 and 1997-98) were followed by near-normal Arctic temperatures relative to the long-term trend.


Looking at a map of the correlation coefficient, we see that the region from the Barents and Kara Seas to the North Pole shows the largest inverse correlation between early winter temperatures and the ENSO conditions of the previous winter.  This region is similar to the area that has seen the most anomalous warmth recently, but this year's conditions are opposite to what the historical correlation shows!  If the historical connection were being reflected this year, then the high Arctic would be cold, not warm, at the moment.  This is puzzling, but it seems to show rather clearly that we can't blame El Niño for the current warmth.


Looking at the MSLP correlation to the previous winter's ENSO index, the map below shows that El Niño tends to be followed by high pressure over western Europe and low pressure over Siberia in November-December of the next year.  Again this is roughly the opposite of what we have seen this year.


Sunday, November 20, 2016

Blog Changes

Long-time readers of Deep Cold will know that the blog's authorship has changed over time; I didn't start the blog, but I've been posting semi-regularly since mid-2013, and I've enjoyed just about every minute of it.  There's nothing more fascinating to me than Alaska's weather and climate, and I have no intention of stopping now.  However, I am probably going to post less often in the next couple of months or so, as I try to devote some spare time to writing an article for publication.

As I step back, however, I expect that a new author will begin to contribute occasionally; I've invited Mike Garrison, a long-time reader and commenter, to add his thoughts and analyses on interior and northern Alaska weather and climate.  Mike is an Alaska resident and avid weather enthusiast, and he works with weather and climate data in the course of his professional employment.  I expect we'll see a few words from Mike on the blog soon.

In the meantime, I was asked recently about a chart of Fairbanks temperature percentiles that I showed here last year.  I decided to clean up the chart and create parallel versions for maximum and minimum temperatures; so here they are.  They serve as a useful reference for the climate in Fairbanks.  Many comments could be made, but I'll just point out one feature that stood out to me: the greater variability of daily high temperatures in summer compared to daily low temperatures.  It's clear to even the casual observer that winter temperatures are much more variable than summer temperatures, but this difference is less significant for high temperatures than for low temperatures, and I hadn't quite appreciated this distinction before.  The reason, I believe, is that the presence or absence of clouds and rain in summer makes a bigger difference for high temperatures than for low temperatures.


Thursday, November 17, 2016

Clearing and Cooler

You know it's winter in Fairbanks when clearing skies bring a temperature drop in the middle of the day.  Today at 11am it was mostly cloudy and +8°F with some very light snow, but by 1pm the clouds were dissipating and the temperature was down to +3°F.  It looks like mostly clear skies will prevail for the next several days, so it will be seasonably chilly.


Snow cover has finally arrived at all the major observing sites of the interior and north, with Nome finally getting a measurable snow cover yesterday - the first of the season.  McGrath appears to have begun its permanent winter snow cover at the weekend, which is of course much later than usual.  Judging from the Suomi NPP landcover image at 1pm today, there seems to be at least a thin snow cover throughout the interior, except in the northeastern Copper River Basin, including perhaps Slana.


Clear skies in the western interior allowed temperatures to drop to a crisp -19°F this morning at the Clear Creek HADS site near Hogatza; this is the coldest report from the interior this month, which shows how warm it has been.  Tanana dropped to -15°F this morning, and McGrath saw -13°F.

Wednesday, November 16, 2016

Sea Ice Update

We're half way through November, and sea ice is finally beginning to close in around the northernmost tip of Alaska, according to the National Weather Service.

Nevertheless, remaining open water in the vicinity of Barrow (soon to be renamed Utqiagvik) is still holding temperatures up whenever the wind direction is onshore.  Today is a case in point: with a light southerly breeze this morning the temperature was around 7-10°F, but it jumped up to 28°F when the wind went around to the west.  So far the lowest daily high temperature this season is 22°F, which shows a remarkable absence of cold; the most similar year in the past was 1998, when the coldest day through mid-November had a high temperature of 15°F.  According to 1981-2010 data, it's "normal" to see a high temperature below zero by this time of year, but this is difficult to achieve without sea ice in place and has rarely been observed in the past decade.

The chart below shows the accumulation of freezing degree days so far this season in comparison to the past 20 years.  The warmth this season is unprecedented in the modern historical era, although early winter 1998 was also very warm; and interestingly that too was a year following a very intense El Niño event.


Here's the long-range sea ice outlook from NWS Anchorage, issued today:

http://tgftp.nws.noaa.gov/data/raw/fz/fzak30.pafc.ico.afc.txt

Interestingly the outlook includes the following:

"NEAR SHORE NAVIGATIONAL WATERS AROUND POINT BARROW WILL LIKELY CLOSE
OFF MUCH EARLIER THAN IN RECENT YEARS...OWING TO THE SEA ICE
REMAINING INTO LATE SEPTEMBER AND EARLY OCTOBER. THESE NAVIGATIONAL
WATERS ARE ALREADY QUICKLY FILLING IN WITH NEW SEA ICE...AND WILL
LIKELY FILL IN WITH GREATER THAN 7 TENTHS NEW ICE BY THE FOURTH WEEK
OF NOVEMBER. OFFSHORE SEA ICE FROM ICY CAPE TO BARROW WEST TO 170W
HAS STARTED TO FILL IN WITH NEW SEA ICE MAINLY OVER THE HANNA SHOAL
REGION. SEA ICE CONCENTRATIONS GREATER THAN 7 TENTHS ARE LIKELY BY
THE FIRST WEEK OF DECEMBER."

This seems a little difficult to reconcile with the record warmth as measured in Barrow lately, so I'll try to obtain some clarification on this.

Update Nov 17: the same statement ("near shore navigational waters around Point Barrow will likely close off much earlier than in recent years") appeared in the September and October sea ice outlooks; I wonder if perhaps these words were left in the latest forecast by mistake.

Monday, November 14, 2016

North Pacific Temperature Update

I added a new post on the Alaska "Blob Tracker" blog this morning:

https://alaskapacificblob.wordpress.com/2016/11/14/dramatic-changes-in-recent-weeks/

The contrast between a strongly positive PDO phase and now strongly negative NPM phase is quite remarkable.  Looking at past years in which this combination was observed during winter, it is typical to see a stronger than usual Aleutian Low and a strong ridge over the western half of Canada.


Unfortunately for snow-lovers, this pattern is a distinctly dry one for interior Alaska and a distinctly warm one for southern and southeastern Alaska.  Of course, there's no guarantee that the North Pacific temperatures will remain in this pattern for the next 3 months, but I wouldn't want to bet against it.


Friday, November 11, 2016

When Will It Get Cold?

Temperatures in Fairbanks have returned to the "significantly above normal" category in the past couple of weeks, with a mean temperature so far this month of more than 5°F above normal.  Only 3 days this season have seen sub-zero temperatures at the airport, which is right on track with the past 3 years but well behind the usual pace.  Snowfall has been extremely meager, only 2.9" in total so far, and the second lowest on record for this point in the season; but at least now the ground is snow-covered and the scene looks somewhat wintry.


The latest long-range forecasts show no sign that significantly colder weather will develop any time soon for interior Alaska.  For example, here are the 8-14 day and 3-4 week forecasts from the Climate Prediction Center.


The raw computer model forecasts are similar, with nothing but warmth expected right through the next couple of months.  However, a look at the current behavior of the Madden-Julian Oscillation (MJO) provides a hint that cooler weather might be on the horizon for later this month.

For those who are unfamiliar, the MJO is a cycle of enhanced and suppressed rainfall that propagates eastward in the tropics, typically completing a circuit around the globe in about 30-60 days.  The latest MJO phase diagram, shown below, indicates that the MJO has moved into a period of strong activity (blue line moving farther away from the origin; the small "10" denotes the latest observation from yesterday, November 10), with the enhanced rainfall now moving across the Pacific.


The MJO is known to have significant impacts on weather patterns in extra-tropical regions, and so a period of strong and predictable MJO activity can provide useful long-range forecast information.  I looked at the impacts on Fairbanks conditions at this time of year by finding all days with significant MJO activity during November in each phase (1-8) and then looking up the subsequent temperature in Fairbanks out to 60 days in the future.  The figure below shows the results.

Notice the pattern when the MJO is in phase 7, as it currently is.  At about 8-15 days after the occurrence of phase 7, colder than normal temperatures are favored in Fairbanks, but warmer than normal conditions tend to return about 25-35 days later.  If the historical pattern holds true this year, then Fairbanks has a fair chance of turning significantly colder about 8-10 days from now.  Let's see if it works out.

Monday, November 7, 2016

Arctic-Wide Warmth

The extraordinary warmth across the Arctic basin in October prompted me to take a closer look at historical temperature data to get a sense for the magnitude of the recent anomalies.  I first did a search for stations with reasonably complete monthly data since 1971, and then I selected 19 sites that lie on or near the coast and also fall within 2000km of the Arctic Ocean's pole of inaccessibility (marked with an X below).  The spatial distribution of the 19 sites is reasonably even around the Arctic Ocean.

The chart below shows the mean temperature anomaly for these 19 stations in each October since 1971.  Remarkably, the 19-station mean temperature in October 2016 was 5.6°C above the 1981-2010 normal and more than 2°C above the 2012 record.  October 2016 was the second most anomalous calendar month in the data since 1971 - only January 2016 was warmer relative to normal, at +6.5°C.


Looking at recent daily temperature anomalies for the same 19 stations, it is amazing to see that the warmth has become even more pronounced since the end of October; the 19-station mean anomaly reached +9.6°C last Thursday (November 3), and on Friday the coolest of the stations was 5.4°C warmer than normal.  In terms of standard deviations, Thursday's mean anomaly was the highest of any day from 1971-present.


Here's the 19-station daily mean temperature for 2016 on an absolute scale rather than an anomaly scale.  Only 7 out of 311 days have been cooler than the 1981-2010 normal, and then only by a fraction of a degree.


Wednesday, November 2, 2016

New Record Low for Arctic Ice

Extraordinary warmth and a remarkably slow freeze-up in the Arctic Ocean in recent weeks have led to new records being set again for lowest observed sea ice extent for the time of year.  Today's write-up from the NSIDC describes the situation nicely:

http://nsidc.org/arcticseaicenews/2016/11/sluggish-ice-growth-in-the-arctic/

Based on the monthly "sea ice index" data from NSIDC, the standardized anomaly of October's sea ice extent was the lowest of any month in the satellite record since 1979.  The previous record was set in May of this year, as we discussed here.


Tuesday, November 1, 2016

Extremely Dry October

Last week I noted the very unusual lack of cloudiness in Fairbanks since the beginning of October, and now that the month's climate data is complete, the magnitude of the anomaly stands out more clearly.

First, it's remarkable to observe that the airport's ASOS instrument reported less than 50% cloud cover on 23 of 31 days, which ties a record for any month of the year: only March of 2002 and March of 2011 had this many mostly-clear days (based on ASOS data since 1998).  Of course, March is usually much less cloudy, with an average of 14 mostly-clear days compared to October's normal of 5 days.  The next closest October for mostly-clear days was 2009, with only 10 days.


The normal seasonal variation of cloudiness in Fairbanks is approximated by the normal relative humidity at 850mb, as measured by balloon soundings - see the chart below.  Based on soundings since 1958, October has the highest normal 850mb relative humidity of any month of the year.  Consider how remarkable it is, then, that October 2016 had the lowest 850mb relative humidity of any month in the historical record (1948-present).


Compared to past Octobers in Fairbanks, the low humidity aloft was really extreme: the monthly mean 850mb relative humidity was 4.9 standard deviations below the 1981-2010 normal.


As noted in the previous post, the clear weather has been caused by a very persistent high pressure ridge over the state, leading to subsidence and drying aloft together with blocking of normal moist westerly winds.  Despite a lack of snow cover for most of the month and windy conditions at times, the clear skies allowed surface temperatures to drop relatively low compared to the pronounced warmth aloft: the month's mean surface-850mb inversion was the strongest on record for October.

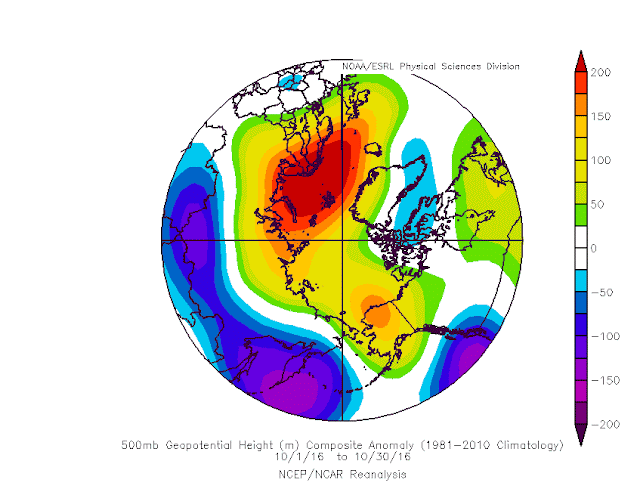
October's "blocking" circulation pattern was pronounced around the Northern Hemisphere, with high pressure across the Arctic Ocean and a strongly negative Arctic Oscillation.  It's interesting to note that the Arctic Oscillation and its cousin the North Atlantic Oscillation have tended to be negative during October in the past 15 years, and this seems likely to be related to the loss of Arctic sea ice at this time of year.


With clouds in short supply over Fairbanks in the past month, precipitation was nearly zero; the October total liquid equivalent was 0.02", the lowest for the month since 1914.  The meager snow cover from the 20th has mostly sublimated or melted away, and the airport's snow depth measurement has been down to only a trace for several days.  However, there's variation from place to place; a downtown webcam showed a thin snow cover today, but the ground is basically bare on UAF's West Ridge and up at Cleary Summit.