Friday, October 27, 2023

Radar Trends

Back in early August, when interior Alaska was seeing an unusually late spell of thunderstorm activity, I commented that it would be interesting to work with the Fairbanks radar data to investigate the variability of strong storms:


I ended up digging into this, and I've succeeded in producing an archive of integrated storm activity back to 2014.  The Fairbanks (Pedro Dome) radar has been around for a lot longer than that of course, and there is some historical data available back to 1997, but unfortunately there is just too much missing data in the early years to use it in this analysis.  There's also a complete gap from 2004 through 2013, and regrettably NOAA/NCEI says that data does not exist any more.

But we'll work with what we have.  My approach was to calculate the spatial area for which the radar reflectivity exceeded various thresholds at each radar scan, across the entire available scan domain, as archived in NOAA's Big Data project.  I used the base (lowest scan elevation) reflectivity and extracted the data on a 1km grid.

There is a myriad of ways that the results could be analyzed, but for starters I took the May-September average of each day's maximum area at or above the reflectivity threshold - such as 40 dBZ, see below.  A 40 dBZ reflectivity is typical of moderate convective rainfall in summer; a typical robust thunderstorm core would be more like 50 dBZ.


Of course many days have no thunderstorms and little or no rainfall across the domain, and most of each season's total activity is concentrated in a rather small number of days, but the season-long average of daily peak activity seems to provide a suitable integrated measure.  Note that I excluded days with less than 100 reflectivity scans in 24 hours; about two-thirds of days have more than 200 scans in May-September.

The overall year-to-year variability in 40+ dBZ radar echoes does not seem particularly great, but the monthly breakdown shows that both July and August of the last two summers were considerably more active than the decadal average.


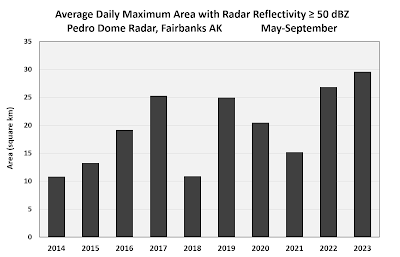
Raising the bar to a 50 dBZ threshold emphasizes the high level of storm activity in the past two summers, especially in July (both years) and August (this year).  August 2023 actually stands out quite dramatically compared to the previous 9 years:


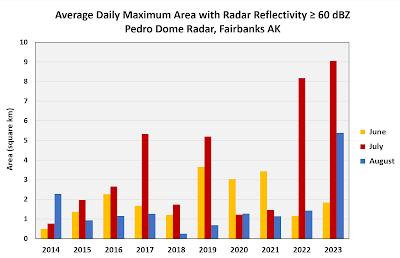
Taking it up still another notch to 60 dBZ, which would be typical of a strong storm producing at least some hail (possibly large), summer 2023 stands out even more compared to prior years, and there's a strong suggestion of an upward trend.  Despite the very short period of record, the linear trend in the first chart below is highly statistically significant.


This data obviously begs for further analysis and investigation, and I'll aim to do that as time permits.  For now, it's just interesting to note that perhaps the unusual spate of severe thunderstorm warnings issued by NWS Fairbanks this summer wasn't as out-of-line as I thought at the time.

Saturday, October 21, 2023

Kaktovik Wind

Blizzard season is off to an early start in Alaska's capital for that kind of thing: Kaktovik, on Alaska's eastern Arctic coast.  Snow has been flying since Thursday morning, and winds increased to 50 mph yesterday evening (with gusts to 60 mph).  Thanks to reader Mike for bringing this to my attention.

October is rather early for this kind of weather in Kaktovik, and it's been more than 10 years since such high winds were observed in October.  In winter proper it's more common, with more than 5% of days seeing sustained winds over 45 mph in November through February.


Here's the meteorological setup: high pressure over western and central Alaska, and a deep low pressure system over Banks Island (as of 4pm AKST yesterday).  My clumsy annotation shows the direction of the strong pressure gradient, and Barter Island's location is indicated with the red dot: click to enlarge.


Thursday, October 19, 2023

Statewide Temperature Index

Last week I mentioned the UAF/ACCAP statewide temperature index (developed by Rick Thoman and Brian Brettschneider), which is a useful tool for quickly visualizing the overall ebb and flow of temperature anomalies in Alaska.  Here's the last year or so (click to enlarge):


Two of the more striking anomalies in recent months were the extraordinary warmth of late summer and the April cold spell.

While I'm a big fan of the index that Rick and Brian came up with, I've been tinkering to see if it can be improved still further.  One of the limitations of the existing index is that it assumes a Normal distribution for daily mean temperatures, but we know that the distribution is significantly skewed at certain locations and times of year.  Here's an old post illustrating this:

https://ak-wx.blogspot.com/2014/03/temperature-skewness-maps.html

To account for skewness, I was able to fit a Skew-Normal distribution to the historical temperatures at each of the 25 ASOS locations used in the ACCAP index.  Using these distributions - which vary through the year - the statewide index can then be recalculated from the newly standardized anomalies at the individual locations.

This modification makes a fairly big difference at certain times of the year.  An extreme example is late March 2019, when extremely warm weather occurred at a time of year when skewness is negative for most of the state.  In other words, negative departures from normal tend to be larger than positive departures, and so a large warm anomaly is actually much more unusual than a Normal distribution would imply.  Here's an illustration of the standardized anomalies on March 22 that year, using a Normal distribution (top) and a Skew-Normal distribution (bottom):


The standardized anomalies are much larger in the Skew-Normal framework, and the statewide anomaly jumps from +2.15 to +2.71.  In terms of degree-of-rarity, the Normal distribution estimates a 98.4% percentile for the day, but the Skew-Normal distribution shows 99.7%.  Both are in the upper tail, but accounting for the negative skewness reveals that the warmth was statistically much more extreme.

It works the other way too: a few months later in 2019, extreme heat occurred in early July, but with positive skewness around Alaska's coastal regions, the large warm anomalies were somewhat less significant than a Normal distribution would indicate.  The statewide standardized anomaly drops from +3.16 to +2.88, which although not a large change implies more than a 50% increase in the climatological probability of such an event (0.08% vs 0.20%).


Of course we could find examples on the cold side too.

In addition to the skewness modification, I also adjusted the statewide index calculation to account for the fact that the (weighted) average of the 25 individual (standardized) anomalies has larger variance in winter than in summer.  This is because there is more spatial correlation of temperatures across the state in winter, so the 25 (standardized) temperature measurements are more prone to move up and down together, and the combined average has a relatively high variance.  In contrast, summer temperature anomalies are more prone to cancel each other out across the state in summer, and the statewide average (of standardized anomalies) varies less.  (This is a completely separate issue from the reduced variance of actual temperatures in summer.)

So rather than using a single number to convert the statewide mean into its own standardized index, I used a seasonally varying number, and this varies by nearly 40% between about January 20 and June 20.  The result is that my modified index shows systematically smaller statewide anomalies in winter than the ACCAP method, but larger anomalies in summer.

Here's a comparison of the past year's statewide standardized anomaly from the two methods.  Notice that the revised method shows smaller values in winter, larger values in summer, and significantly less extreme cold in April (because of the negative skewness).


And here's the actual ACCAP index, which shows the statewide value in terms of percentile/frequency rather than standardized anomaly.


The major difference between the anomaly view and the percentile view is that the percentile view doesn't differentiate the magnitude of extreme events, i.e. once you're in the top or bottom 5-10% of events, they all look quite similar in the percentile view.  In contrast, the anomalies clearly delineate the amplitude of extreme events, but on the other hand they don't provide an intuitive measure of frequency: most people don't have a sense of how rare a 2 or 3 standard deviation event is.  Both perspectives are useful.

My next step with this work is to set up an automated process to create daily graphics and perhaps a simple webpage for monitoring purposes.

Friday, October 13, 2023

Early Snowpack

The onset of winter sometimes seems to occur almost instantaneously in Alaska.  The sudden change of season happens most obviously when temperatures drop more rapidly than usual around the climatological transition into the long freeze of winter, leading to a nearly binary switch from above-freezing to persistently below-freezing.  This year is an example: here's a chart of daily mean temperatures in Fairbanks since August 1.  The arrival of cold with the first snow on October 3 marked the sudden change.


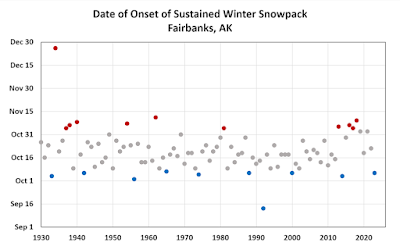
Assuming the five inches of snow now on the ground in Fairbanks doesn't melt out, October 6 this year will mark the earliest onset of the sustained winter snowpack since 2014, and within the top 10 earliest since 1930.  Read some comments from 2014 here:


There's no significant trend in snowpack onset dates for Fairbanks, and interestingly the 10 earliest dates have occurred at quite regular intervals over the decades.  The latest onset dates show more clustering: a few in the 1930s, and another group in recent years.


Looking farther north in the interior, Bettles also shows no trend (with data since 1951).  The roughly 180 miles makes a difference of about 9 days in the median date (October 10 in Bettles, October 19 in Fairbanks).


However, it is interesting to see that Bettles has not seen a September onset for 15 years now, whereas it occurred 8 times between 1950 and 2010.  Only once (1992) has Fairbanks seen a September snowpack start.  Conversely, Bettles hasn't seen bare ground at the end of October since 1974, whereas it's not too unusual in Fairbanks (and seemed to become commonplace in the last decade or so).

In other interior weather news, Tanana reached a chilly 0°F yesterday morning.  This is the earliest 0°F reading in Tanana since 1996, and it's good for 10th earliest (tied) in the history since 1901 (with some missing data).

Overall the state is seeing the coldest start to October since 2014, judging from the ACCAP standardized statewide index.  Except for 2021, every year from 2015-2022 was quite a bit warmer than normal for the first two weeks of October, so it's a refreshing change.


Thursday, October 5, 2023

Signs of Freeze-Up

A dry and chilly north wind has kept wet bulb temperatures at or below freezing today across much of western and northern Alaska, and that means fresh water ice formation is likely beginning on many water bodies.  One of the first places where it's easy to spot from afar is the Koyuk River where it empties into Norton Bay.  Here's this afternoon's webcam view courtesy of the FAA:


The ice collected on both sides of the river over the course of the day today; here's a simple animation.


Looking back at this blog's archives, I noted the ice formation at Koyuk on the following dates in previous years:

October 24, 2013

October 9-11, 2014

October 18-20, 2017

October 14, 2019

October 14, 2022


In other news, it was 0°F at Anaktuvuk Pass this morning, and nearly as cold at some of the interior RAWS sites: +1°F at Norutak Lake and +2°F at the Beaver RAWS in the Yukon Flats.

And yesterday the rarely-operational Galbraith Lake thermometer reported -8°F on the north side of the Brooks Range.  This appears to have been the first sub-zero temperature of the season observed in Alaska.

Tuesday, October 3, 2023

First Snow in Fairbanks

The first accumulating snow fell in Fairbanks today - right on time according to the calendar.  The median date since 1930 is October 2nd.  But these were also the first flakes to be reported in the air at the airport, and that typically happens a few days earlier: September 26 on average.


This morning's Fairbanks sounding showed a temperature profile entirely below freezing, and it's also the first time that has happened so far this season.  This is also close to normal.  The odds of any particular 3am sounding being entirely below freezing in Fairbanks rises approximately as follows:

10%   September 20

25%   October 1

50%   October 10

75%   October 27

85-90%   November 15


It's more uncommon to see a sub-freezing profile in the 3pm sounding at the beginning of October, because there's still a modicum of solar heating to produce a modest diurnal temperature cycle.  Today's 3pm sounding reported exactly 0°C a small distance above the ground.  But the historical frequency of a fully sub-freezing afternoon profile rises quickly as that solar heating gets snuffed out:

10%   October 3

25%   October 9

50%   October 18

75%   November 1

85-90%   November 15


Appealing views from the Nenana webcam today: