Friday, March 25, 2022

North Slope Cold

For the third year in a row, the North Slope of Alaska has seen a relatively cold winter, i.e colder than in many recent years.  With a week left to go, the November-March period has been the coldest since 2012-2013 in both Utqiaġvik and Umiat.  The deep winter period of December-February was colder two years ago, but that was mostly because of a very cold February 2020.  Interestingly, February has been easily the coldest month of each of the past 3 winters on the North Slope.

This winter the cold was somewhat persistent from mid-November on, and each month from November through February was colder than the 1991-2020 normal (and the 1981-2010 normal) for the North Slope climate division.   This is also true for the Northeast Interior climate division, but nowhere else in Alaska.  However, with significant warmth in early March, it looks a bit unlikely that this month will be the fifth consecutive below-normal month.


In Umiat the number of days (72) reaching -30°F or lower was the highest since 2011-2012, but it only reached -50°F three times (compared to 11 times in Jan-Feb 2020).  Utqiaġvik did not manage to reach -40° after succeeding in the last two winters.

I found myself curious about the correlation between winter temperatures on the North Slope and temperatures elsewhere in Alaska and farther afield, so here's a map.  I've used detrended November-March average temperatures from ERA5, and the map shows the correlation with a grid cell near Umiat.

The interesting aspect of this to me is how the Brooks Range forms such an effective boundary in the temperature anomalies: the correlation between North Slope and interior Alaska winter temperatures is really modest - mostly less than +0.6 (i.e. less than about a third of the variance is joint).  According to ERA5, Umiat winter temperatures are better correlated with temperatures over the central Bering Sea than in Fairbanks or even Fort Yukon.

(Note that I checked the ERA5 data against actual observations from Umiat since 2007, and the performance is surprisingly good: correlation of +0.99.)

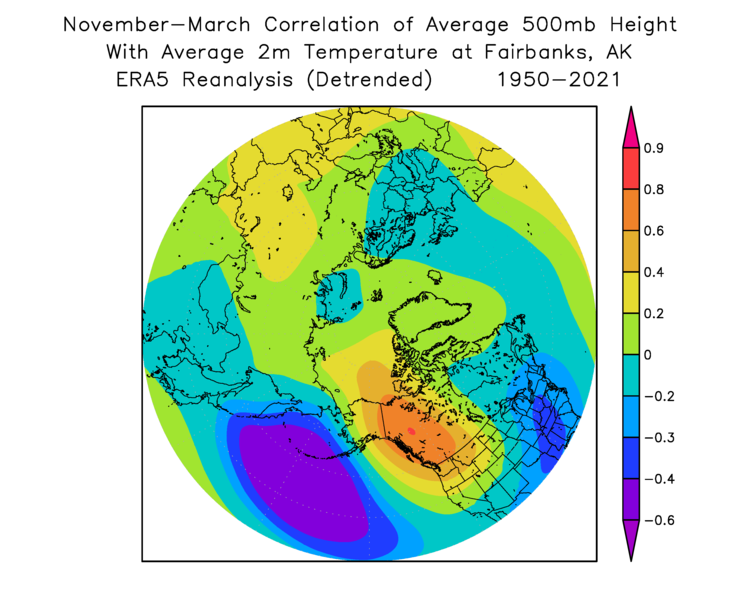
Here's the same correlation map but for Fairbanks winter temperatures: this shows a much more expansive area of high correlation, including across the Alaska Range (much higher elevation than the Brooks Range).

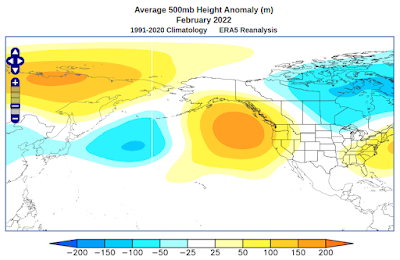
To visualize the flow patterns that have the greatest linear relation to winter temperatures in Umiat, the map below shows the correlation with 500mb height.  A ridge anomaly right over Alaska is favorable for North Slope warmth in winter, but a trough tends to brings cold.  This contrasts with the more expansive (PNA) correlation pattern for Fairbanks - second map below.


For completeness, below are the MSLP correlations.  Interestingly, low pressure over the eastern Bering Sea is closely connected to winter warmth in Fairbanks, but it has the opposite correlation (albeit slight) with Umiat temperatures.


I'd be interested to hear any other observations from readers.

Friday, March 18, 2022

Precipitation Changes

As many readers are aware, it's been an extremely wet winter in western and interior Alaska.  Here are percentile maps for this winter's December-February total precipitation compared to all other years in the ERA5 gridded data (top map) and NCEI's climate division data (bottom map):


The 3-month total was the highest for Dec-Feb across large areas in both data sets, and it was the wettest Dec-Feb period on record for the NCEI state average (data since 1925).

This remarkable outcome reinforces the striking change to wetter conditions in recent years in Fairbanks in particular (where December-February this winter was the wettest since 1936-37).  I've written a number of times about the Fairbanks change that occurred in 2014 - see the blog links at the bottom of this post for a review.

The chart below highlights the change effectively; the 12-month running total precipitation has remained at a high level since that extraordinary summer of 2014 (14.5” of precipitation in June-September, the highest on record).  The longer the sustained wet pattern persists, the more it looks like a true “regime change”, i.e. a new climate normal that has suddenly emerged; but of course 8 years is a relatively short period in climate terms, and it remains to be seen how long the new situation will persist.


The chart above also reveals something else that I find very interesting: the green line shows the 12-month precipitation from days with 0.22” or less of precipitation.  From 1930-2013, such days supplied half of the total precipitation in Fairbanks (but more than half in winter, less than half in summer).  Notice that the running totals from these “lighter” precipitation days have seen only a modest increase – certainly not enough to account for the overall precipitation increase, and not that different from what happened, say, in the mid-late 1940s or around 1990-1993.  Notice too that the “lighter” precipitation totals didn’t rise until the wet autumn of 2017, i.e. more than 3 years after the overall total jumped up.

This means, of course, that a change in "heavier" precipitation days has caused the lion's share of the overall precipitation increase.  This is illustrated in the chart below: in earlier decades, the running totals spiked up occasionally in tandem with the heavier amounts, but the joint increase has been sustained since 2014.  From 2014-2021, the frequency of "heavier" days (0.23" or more) increased by about 50% (while the frequency of much-more-common "lighter" days did not change), and for this 8 year period the heavier days supplied over 60% of the total precipitation.


Another interesting facet of the last 8 years is the changing distribution between summer and winter precipitation.  As noted above, it was the summer of 2014 that kicked it all off, and the next two summers were also very wet; but since then, summer rainfall has been closer to (but still above) prior normals.  The chart below shows how the May-September totals have dropped back somewhat since 2014-2016.


Of course, with less excessive summer rains, cold-season precipitation must have picked up to sustain the very high annual totals, and that's easily seen by inverting the chart columns (and note that the October-April numbers are calendar year totals):


Starting in 2017 - in response to the wet autumn of 2017 - the cold-season precipitation jumped up and has remained high for five years, with 2021 setting a new record.

So it turns out that the sustained nature of the high 12-month totals is related to precipitation increases in both summer and winter, with winters picking up the "slack" from the less-extremely-wet summers of the past five years.

It will be interesting to see where we go from here.  If both summer and winter remain much wetter than earlier decades, then the new regime might be reinforced as both ends of the year make big contributions going forward.  But my suspicion is that decadal-scale changes in the North Pacific are a significant part of the explanation for the new "regime", and in due course we're likely to see a shift to something different.  For example, unusual North Pacific warmth associated with the positive North Pacific Mode emerged in mid-2013 and has been a semi-permanent feature ever since.  I could be wrong, but I doubt that particular spatial pattern of sea surface temperatures will be truly permanent.

Here are some earlier posts on precipitation changes, with a focus on the warm season.  There are probably others I've forgotten about!

https://ak-wx.blogspot.com/2021/05/warm-season-precip-normals.html

https://ak-wx.blogspot.com/2020/08/back-to-rain.html

https://ak-wx.blogspot.com/2020/07/rainfall-trends.html

https://ak-wx.blogspot.com/2020/07/wet-summers.html

https://ak-wx.blogspot.com/2017/07/wetter-in-july.html

Wednesday, March 9, 2022

February Climate Data

February data are in from the usual sources, so here's a quick look back at an eventful month in Alaska climate.  The circulation pattern was quite unusual, as Alaska found itself caught between two strong ridges - one to the south and southeast over the northeastern Pacific, and another extending from eastern Russia to the Arctic Ocean north of Alaska.


This complex setup had the effect of creating a persistent frontal zone across the southern half of the state.  The trough/ridge dipole over the North Pacific brought up abundant warm air from the south, but the other ridge/trough dipole to the north generated cold northerly flow, with low-level easterlies, that locked in cold conditions over Arctic Alaska.  Here's a map of wind vectors at 700mb, or about 9000 feet above sea level.


Frontal zones mean precipitation, and there was a lot of it in southern and eastern Alaska.  Total precipitation for the month was near or above the highest in the past 30 years for most of the southern and eastern interior, Gulf Coast, and Southeast.


There's obviously a big disagreement between the ERA5 model data and NOAA's climate division data for the North Slope and northwestern Alaska.  Given how few ground truth snow measurements are made in northern Alaska, I'd actually give more credence to the model.

The March 1 snow survey shows record or near-record snow water equivalent across a wide expanse where measurements are made.  There's clearly a much-elevated risk of flooding during breakup this year.  Click to enlarge:


The temperature rank maps below highlight the unusual north-south contrast in the departures from the normal.  As Rick Thoman pointed out, it's much more common to have a west-east gradient in the anomalies.


Here's Rick's station anomaly map:


And a couple of other variables from ERA5, showing big departures from normal in many areas:


Sunday, March 6, 2022

Cold versus Warm Variance

In the past week I've been thinking about temperature volatility and the fact that it tends to be higher in Alaska winters during La Niña, when colder conditions are favored overall.  This suggests a possibility that cold weather regimes are inherently less stable and persistent than relatively warmer weather regimes; so you're more likely to see similar conditions persist when it's warm than when it's cold.

But does the data support these conjectures?  To address this, I took the daily mean temperature in Fairbanks winters from 1980-2021 and calculated the daily standardized departure from normal, i.e. the difference from the 1981-2010 normal (for convenience) in terms of standard deviations.  I then sorted the more than 6000 daily values into 10 equally populated categories, and finally for each category I calculated the standard deviation of temperature within +/-15 days of each individual day.  Here's the result:


This shows that, for example, the standard deviation is over 15°F within +/- 15 days of the coldest 10% of Fairbanks days in November-March.  This is the highest variance of any of the categories and supports the hypothesis that the highest volatility occurs when it's much colder than normal.  However, the variance is also enhanced when it's very warm - but not quite as much as when it's cold.

Thinking a bit more about this, the result above is partly a reflection of the slight negative skew in winter daily temperatures in Fairbanks.  Here's a histogram of the daily standardized temperature anomalies: the median is slightly above zero, because I used an outdated 1981-2010 normal, and the distribution has a slightly longer tail on the cold side.


In a situation with negative skew, it's clear that negative departures tend to be larger in magnitude than positive departures, and that's the same thing as saying that the variance is higher on the cold side.

However, there's a bit more to this than just skew: I also calculated the frequency with which the temperature reverses to the other side of normal in the next 15 days, for both the coldest and warmest categories of daily temperature.  When temperatures are in the lowest 10%, there's a 9.0% chance of an above-normal temperature occurring within the next 15 days, but when temperatures reach the highest 10%, the frequency of below-normal within 15 days is a bit less, at 8.5%.  So this too reflects the fact that cold gives way to warm slightly more often than warm gives way to cold.

Interestingly this "sign reversal" statistic is very similar for summer in Fairbanks: 9.5% versus 9.0% (cold to warm versus warm to cold, respectively).  However, the skewness is almost zero in summer, and there's no difference in variance between the coldest and warmest decile categories.


How about other locations in Alaska?  Winter temperatures have a more significant negative skew in Anchorage, where cold interior air sometimes makes an appearance, and so variance is easily the largest when it's cold.


It's the same story at Juneau, which has a very pronounced negative skew in winter daily temperatures:


Like Fairbanks, both of these sites also have a higher frequency of reversing from the lowest decile to above-normal than from the highest decile to below-normal.  This is interesting, because the lowest decile is farther from "normal" than the upper decile, so a bigger change is required to make that reversal when it's cold.

However, the skewness is reversed for Anchorage and Juneau in summer, because the maritime influence then suppresses variance on the cool side.  Consequently, temperature variance is highest at the upper end of the distribution in summer.


While I'm at it, here are results from Utqiaġvik and Nome.  The former sees considerable positive skewness in both summer and winter, with the greatest variance on the warm side, although the extreme warming trend might make a difference to this analysis.  Nome is more aligned with the rest of the state, with negative skew in winter and positive in summer.


Here's the "sign reversal" statistic for all 5 sites.  Again, this shows the percentage of time that an opposite-sign anomaly occurs within 15 days of the lowest and highest deciles respectively.

WinterCold to WarmWarm to Cold
Fairbanks9.0%8.5%
Anchorage9.1%8.4%
Juneau8.9%8.0%
Utqiaġvik8.3%8.6%
Nome8.6%8.9%


SummerCold to WarmWarm to Cold
Fairbanks9.5%9.0%
Anchorage9.0%8.7%
Juneau9.4%9.5%
Utqiaġvik9.6%9.1%
Nome9.3%9.5%

One more comment before I close.  It seems physically reasonable that cold tends to be associated with greater variability, because cold in Alaska is usually associated with a blocking ridge over the Bering Sea or Arctic Ocean - and these patterns can bring huge variations in temperature with relatively small shifts in the position of the ridge.  On the other hand, warmth in Alaska - especially in winter - is associated with a strong Aleutian trough and a ridge over western Canada, and this tends to be a more stable pattern bringing indiscriminate and persistent warmth over most of Alaska.

In other words, because typical cold and warm patterns in Alaska are not at all opposite to each other, they behave differently.  As a very broad and overstated generalization: when cold comes, it's relatively fierce but tends to be short-lived, whereas warm tends to be a bit less amplified but more persistent.