Monday, December 28, 2020

Decadal Warming

The other day Rick Thoman published an interesting comparison between average temperatures in the past decade and the 1981-2010 normals, for Anchorage, Fairbanks, and Utqiaġvik.  On average, the decade has been warmer than the prior 30-year baseline throughout the year for all three cities, but late autumn really stands out as having seen the most exceptional warming at all three sites - and especially in Utqiaġvik, as we've documented here many times before.


An additional aspect that stood out to me is how warm the decade has been in Anchorage, given that Anchorage has the smallest temperature variance of the three locations.  In a climate that's inherently less variable, a relatively small temperature change takes on greater statistical significance.

One way of leveling the playing field is simply to divide each day's decadal temperature anomaly by the 1981-2010 standard deviation of daily mean temperature on that day.  With a little help from Rick, I managed to come close to reproducing his results, and the charts below show the comparison of the absolute (top) and standardized (bottom) temperature anomalies.

The second chart illustrates my point about Anchorage, particularly for summer and autumn: the last decade has been really exceptionally warm in Anchorage when we factor in the low variance of temperatures in the prior decades.  I typically think of Utqiaġvik's autumn warming as being "unrivaled" and "off the charts" in terms of statistical significance - and it is - but this simple analysis suggests that Anchorage is arguably not that far behind in terms of how persistently warm it's been in late summer and autumn.

If we focus on temperatures for August and September in Anchorage, we find a similar result for conditions averaged over the two month period.  In the past 10 years, the Aug-Sep mean temperature has been 1.3 standard deviations above the 1981-2010 mean of Aug-Sep temperatures.  This is actually greater than the October standardized anomaly in Utqiaġvik: the October mean temperature in Utqiaġvik has been 1.2 standard deviations above the 1981-2010 baseline.

When we compare the two time series in absolute terms (see below), Utqiaġvik's change is obviously more eye-catching, not least because of the amazing collapse in variance nearly 20 years ago.  However, the last 5 years of early autumn conditions have certainly been very exceptional in a local sense in Anchorage; and this is connected to persistent and remarkable warmth across the entire North Pacific - a topic for another time.


Saturday, December 19, 2020

More on Wind and Cold

Wind chill has been a concern across much of interior and northern Alaska in recent days, with a notable combination of wind and cold in many locations.  The more exposed locations of course had the worst of it; Eagle Summit saw a wind chill of -66°F on Thursday morning (-30°F temperature with 28mph wind), and Brooks Range passes have been very cold in the past couple of days.  The Arctic coast has had several rounds of strong winds in the past week, but residual warmth from the ocean kept temperatures a little higher, at around -10°F or so.

As usual, the "winner" in the wind chill department is Howard Pass, with a wind chill down to -71°F yesterday evening.


This latest episode of extreme weather at Howard Pass, and comments from reader Gary on last week's post, led me to do a comparison of wind and temperature data from relatively nearby stations in the western Brooks Range.  The results illustrate nicely the unique and highly localized winter climate of the Howard Pass site.  Here's the location we're talking about, for those who may not be familiar (click to enlarge);


First, the chart below shows the joint distribution of daily mean temperature and wind speed at Howard Pass in the winter months.  There's a huge amount of missing data, because the instrumentation often fails to make it through the winter owing to the harsh conditions; the last reasonably complete winter of data was 2016-2017.  Nevertheless, there's plenty of evidence to show the remarkable inverse correlation of temperature and wind in winter: the lowest temperatures always come with wind, and high winds almost always bring serious cold.  This is because cold air from the North Slope is funneled up and through the pass from a NNE direction, as in today's observations above.  The strongest pressure gradient across the Brooks Range tends to accompany the coldest conditions on the North Slope, so this is a recipe for extreme wind chills at favored pass locations.


The same chart for the Imelyak RAWS, about 40 miles to the south and 1500 feet higher in elevation, is completely different:


The absence of cold, let alone cold plus wind, is quite remarkable at Imelyak; with nearly complete data since summer 2012, the lowest minimum temperature recorded is only -37°F.

Here's the joint distribution of winter wind chill for these two sites.  Here I've calculated wind chill from the daily mean temperature and wind speed, rather than starting from hourly data, so it's not a true daily mean wind chill (because the formula is non-linear).


A histogram format shows another view of the same thing: Howard Pass completely dominates on the low wind chill side of the distribution, even though Imelyak is 1500 feet higher in elevation.


Another relatively nearby observing site is the top-quality Ivotuk CRN installation, about 37 miles to the northeast of Howard Pass as the crow files.  Despite a similar elevation, Ivotuk has a wind-temperature relationship that looks much more like the interior North Slope: not much wind, and when it does get breezy, it's almost always warm.  The contrast from Howard Pass is really striking.


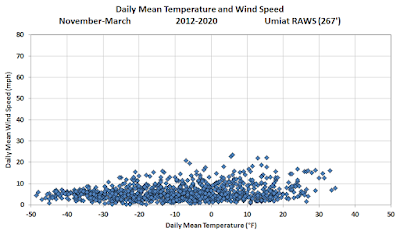
Here's a chart from the classic interior North Slope site: Umiat, another 100+ miles to the northeast.


Note that winter temperatures are highly correlated between Ivotuk and Howard Pass; they usually experience the same air mass, but the wind speed behavior is opposite.  (The coldest days at Howard Pass are missing on this chart because Ivotuk didn't start reporting until 2014.)


In summary - this is simply more documentation of the unique and fascinating local winter climate at Howard Pass.  As always, thanks to Ken Hill and Pam Sousanes (and probably others) for their persistent efforts over the years to maintain the Howard Pass site.


Wednesday, December 9, 2020

Wind and Cold

After last week's extreme rainfall in Southeast Alaska, a noteworthy North Pacific storm brought a lengthy episode of strong winds to southwestern parts of the mainland earlier this week.  Here's a surface analysis from 3am Sunday, courtesy of Environment Canada:


Bethel had two unusually windy days on Sunday and Monday - with snow and temperatures down near 0°F to start - and the wind was really howling at the more exposed locations.  For instance, Cape Romanzof (admittedly a very windy place) reported sustained winds around 60-70 mph for a full 24 hours, with gusts of 80 mph.

Our old friend Howard Pass, up in the western Brooks Range, also saw a modest blow as the pressure gradient worked its way north this week.  In characteristic fashion, the temperature dropped as the wind picked up at the pass, and bottomed out at -20°F with 40-45 mph winds.  Nasty, but nowhere near the conditions that have been observed there on some past occasions.


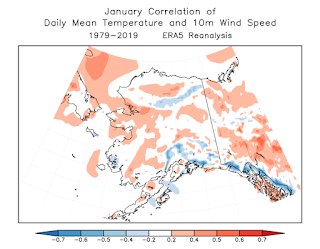
The fact that the strongest winds in western Alaska often seem to prevail from a northerly direction got me thinking about whether there is in fact an inverse correlation between temperature and wind speed in these areas.  In the interior lowlands we would generally expect the opposite in winter: wind brings warmth, but what does the relationship look like on a map?

With the ERA5 reanalysis, we can answer this question with a fair degree of confidence.  The sequence of maps below shows the correlation coefficient of daily mean 2m temperature and daily mean 10m wind speed, by month, from 41 years of data.  Click the images to enlarge.


Interesting features to me are:

- Inverse correlation (cold when windy) in the highest elevations

- Positive correlation (warm when windy) in winter across the interior North Slope, the Kobuk valley, the Yukon Flats, the mid-Tanana valley, and elsewhere in the lower elevations of the west.

- Inverse correlation in summer across western Alaska and the oceans (warmth occurs in conjunction with high pressure and reduced winds)

- Very high positive correlation in the warm half of the year across northwestern Canada and parts of eastern Alaska - but apparently not directly corresponding to elevation.  I'm not sure what to make of this.


If readers have any comments or insight on the patterns, I'd be glad to hear them.

Thursday, December 3, 2020

Southeast Deluge

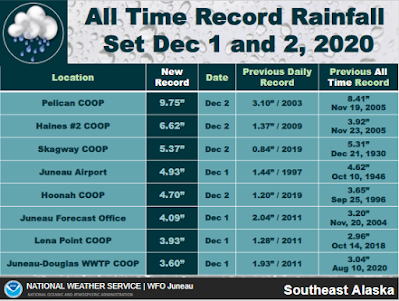
I don't usually comment on weather in Southeast Alaska, but the past few days brought an extremely intense rain storm that broke longstanding records in the northern part of the region.  All-time records for calendar-day precipitation fell at Juneau, Skagway, and Haines, and unfortunately damage from flooding and a major landslide occurred in Haines.  Here's a summary from NWS Juneau as of 11am yesterday, and more rain fell after that.


The two animations below show precipitable water (the total vertical atmospheric water content) during two 24-hour periods, illustrating the tropical moisture source and the remarkable persistence of the "atmospheric river" directed into the Southeast.


Here's another really nice animation:


If we look at past episodes of extreme rainfall in Juneau in early winter (October through December), it's interesting to note that 5 of the top 6 (since 1950) highest 2-day precipitation totals occurred during La Niña conditions, and 3 of these were rather strong La Niña episodes similar to the one we're currently experiencing.  Those 3 events were Oct 19-20, 1998, Nov 29-30, 1988, and Dec 27-28, 1999.

This is an interesting point because La Niña more often brings drier, not wetter, conditions to Southeast Alaska for the second half of the rainy season as a whole (i.e. early winter).  Since 1950, 10 of the 15 strongest La Niña's in October-December were drier than normal overall in Juneau, and the map below shows the spatial pattern of early winter precipitation for strong La Niña years.  More investigation would be needed to be sure, but this may be an example of weather extremes having a different sensitivity to climate forcing than seasonal weather averages.


I mentioned last month that Fairbanks also has an enhanced frequency of heavy precipitation events during La Niña winters.  The chart below illustrates this for 2-day snowfall totals of 6-9" (blue) and over 9" (purple).


The same relationship (warmer ENSO -> lower chance of heavy snow) is evident in both early winter and late winter.

Update: NWS Juneau provided a list of sites that recorded all-time record daily rainfall amounts.