Wednesday, January 27, 2021

Cooling in March

A couple of weeks ago I compared the new 1991-2020 temperature normals to the previous climate period of 1981-2010, and one of the interesting features that stood out was the widespread change to slightly cooler conditions in March.  With the exception of Utqiaġvik, which has of course seen rampant warming, all of the climate sites I looked at showed a cooling trend in March; and March is the only month with a statewide decrease in the 30-year normal temperature.

Here's a map of the March temperature difference according to ERA5:

The cooling is quite widespread in the southern half of mainland Alaska, but the magnitude of the temperature difference is small: rarely more than 1°F.  Contrast this with the much larger warming that occurred in the neighboring months of February and April, particularly across western Alaska.


If we look at 3 climate observing sites with noticeable March cooling, we see one key reason for the anomaly: the 1980s were exceptionally warm in March, and that decade has dropped out of the new climate normal period. 


The 1990s were very warm too - notice the complete absence of cold March's in both the 80s and 90s - but then some cold re-emerged after the turn of the century, and Bethel in particular had a spate of cold March's.  Interestingly just a few years ago Bethel's 30-year running average for March was distinctly lower than it is today, so if for example the climate normal period had changed 5 years ago, the new normal would have been more than 2°F colder than the one 10 years before.

Clearly, annual and decadal variability play a large role in the details of the changes from one climate normal period to the next, and this becomes most evident where annual and decadal variance is large compared to the magnitude of the long-term warming trend.

Some readers will have recognized already that the PDO phase is a prime candidate to explain the decadal variability we're considering here - which is to be expected, given that it's the Pacific Decadal Oscillation.  Here's a chart of the March PDO index; notice the remarkably persistent positive phase of the 1980s and the return of some significantly negative values around 2008-2013.

But an obvious question then is - if the PDO is responsible for the March cooling, then why did February and April warm so much?  The PDO tends not to change drastically from month to month, and indeed it was strongly positive in the 1980s in February as well.  However, Bethel's February temperatures (for example) have warmed dramatically in the past two decades compared to the 1980s.


The explanation for this month-to-month contrast is (I believe) that we're dealing with natural variability that has pushed the monthly decadal trends in different directions.  In other words, it just so happens that February and April have recently been warmer than we would have expected based on the long-term trend and the PDO phase; and on the flip side, March has been colder than we would have expected.  If we somehow had another "realization" of recent decades, it could equally well have been the other way around, with relatively subdued warming in February and April and much larger warming in March.

To support this idea that "luck of the draw" with the weather patterns explains the different trends, the maps below show the 2011-2020 average departure from normal for MSLP and 500mb height in March.  This is a relatively cold pattern for southern Alaska, with a ridge axis over the Bering Sea that produces a northerly component to the flow to the east of the ridge.


In contrast, February's of the past decade have tended to see a ridge over the Gulf of Alaska and low pressure over the Arctic Ocean, and this combination brings a lot of warm air up from the southwest.

The decadal pattern for April (see below) is quite different, but low pressure near the Aleutians is another typical signal for warmth in southern Alaska (this is an El Niño-like pattern).  Clearly then the monthly weather patterns of the past decade are aligned with the observed differences in trends: cool in March, very warm in February and April.


The pattern analysis works at the other end too, in the 1980s: it just so happens that March's from 1981-1990 had the warmest pattern of the 3 months - see below.  Consequently, March in the 1980s tended to be warmer than expected based on the background temperature baseline and the (very positive) PDO phase.  And so with unusual warmth in 1980s and a cool pattern in the past decade, it's no surprise that the 30-year normal has turned a bit cooler for this month.


Monday, January 18, 2021

Siberian Warmth in 2020

One of the most striking and memorable global climate stories of 2020 was the remarkable and persistent extreme warmth that occurred in Arctic Russia.  The sheer magnitude of the anomaly for the annual mean temperature in north-central Siberia was simply amazing: over 5 standard deviations above the 1981-2010 normal.  Here are maps from the ERA5 reanalysis and from surface station measurements (click to enlarge):

The agreement is very good: every station over a wide area in north-central Russia saw an annual temperature over 3 SD above normal, and 3 sites exceeded 5 SD in the region where ERA5 data highlighted the most significant anomalies.  Of course there was a lot of very anomalous warmth elsewhere around the Northern Hemisphere (and globe) as well, but clearly Russia's Taymyr Peninsula was the epicenter of warmth.

Here's a chart showing the history of annual mean temperature for the 3 sites with over 5SD anomalies; Khatanga was the "winner", with a mean 2020 temperature of -6.4°C compared to a 1981-2010 mean of -12.2°C and standard deviation of only 1.1°C.  February, April, and November were all more than 10°C above normal, 3 more months were over 5°C above normal, and only December was less than 2°C above normal.


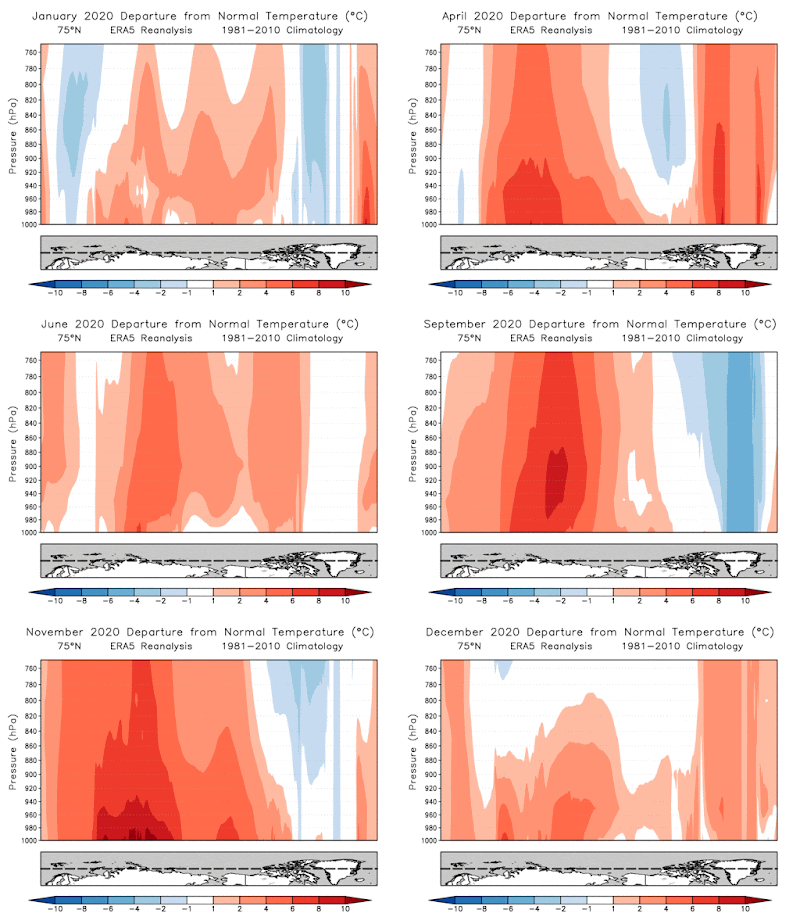
It's interesting to look at the vertical structure of the temperature anomalies using ERA5 data.  Here's a cross-section around the Arctic at 75°N for the lowest 25% of the atmosphere.  The departure from normal was far greater near the surface than aloft, although the anomaly for the year still exceeded 3°C at 750 mb (about 8000 feet elevation).


Here's the actual annual mean temperature (absolute, not anomaly) for the same cross-section:


And here's the 1981-2010 normal:


It's interesting to see that normally the annual mean temperature is approximately constant with height up to about 900mb in the vicinity of the Taymyr Peninsula, and farther east the normal temperature profile shows an inversion over the East Siberian, Chukchi, and Beaufort Seas.  But in 2020 the more well-mixed environment of the Barents Sea extended dramatically farther east than normal (on an annual-mean basis).

Here's an animation of the temperature anomaly cross-section on a monthly basis.  Again, the sheer persistence of the warmth in north-central Russia is remarkable.


What causes can we identify for the amazing 2020 anomaly?  Extraordinary conditions began to emerge early in the year in association with a strongly positive phase of the Arctic Oscillation that swept warm Atlantic air eastward across Siberia and the Russian Arctic.  Warm westerly flow therefore dominated the first three months of the year in association with the AO, and then as winter gave way to spring, the pattern shifted in such a way that very warm air continued to flow into the region; this new setup involved a trough over western Russia and a ridge over central Siberia.  See below for January-March and April-May 500mb height anomaly maps.


With the arrival of summer, the circulation pattern shifted again, and yet again it favored unusual warmth along Russia's Arctic coast, but by this time I think the feedback associated with reduced sea ice and soil moisture was at least as important for maintaining the warm anomaly.  Owing to the winter and spring warmth, Arctic sea ice was much thinner than normal near Russia's coastline, and it quickly broke up over the East Siberian Sea in June and July, removing a key cooling mechanism that would normally be present near the coast until much later in the summer.


Another factor that drove unusual warmth through the summer was the prevalence of dry soils caused by the early loss of snowpack and greatly enhanced drying under warm conditions - and also exacerbated by high pressure and reduced rainfall over central and eastern Siberia.  Wildfire activity was widespread and intense.  Here's a late August soil moisture map from ERA5.


As summer ended, the impetus towards unusual warmth was then reinforced with new vigor into the autumn months as sea ice was far below normal across most of the Arctic; the Arctic-wide ice extent almost set a new record low in 2020.  The excess heat available from open ocean rather than ice-covered ocean has been a major contributor to enhanced warming trends in the Arctic during autumn over the last two decades.


Finally, to top it all off, the Arctic pattern returned to a strongly positive AO phase in November, bringing a renewed warm westerly flow to the Russian Arctic.  Khatanga saw its warmest month of the year in terms of departure from normal, with a massive +11.3°C anomaly: the November average temperature was -13.3°C versus a 1981-2010 normal of -24.5°C.  December then brought cooler northerly flows, but the month was still warmer than normal.


Wednesday, January 13, 2021

New Climate Normals - Temperature

Once every 10 years, the world of climate science transitions to a new 30-year normal period for the purpose of climate monitoring, and 2020 marked the end of the most recent normal period.  The choice of a 30-year window is nothing more than conventional practice; here's a bit of background from the WMO (click to enlarge).


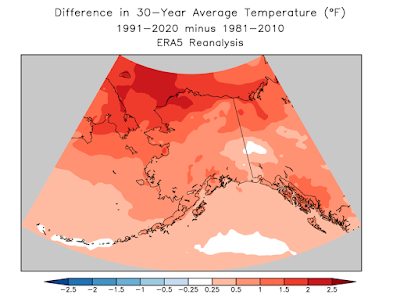
Based on ERA5 gridded data, here's a look at how Alaska's annual average temperature changed between 1981-2010 and 1991-2020:

Most of Alaska to the north of about 65°N warmed by more than 1°F, and of course the greatest change was seen on the North Slope - and especially in Alaska's northwestern Arctic territory.  Substantial warming of more than 1°F also occurred in the southern half of the Alaska Panhandle, according to this data.

Here's how the changes look in the wider hemispheric context north of 45°N.  Alaska's Arctic warming was only a small portion of a wide swath of 1.5-2°F warming that stretched across the Russian side of the Arctic to the Barents Sea.

The ERA5 temperature changes are broadly consistent with data from surface observing sites across Alaska.  According to NOAA/NCEI data, the state warmed 0.8°F as a whole, and climate observations include changes of +2.0°F at Utqiaġvik, +0.3°F at Fairbanks, and +0.7°F at Anchorage.  Interestingly, however, Juneau warmed only 0.2°F, considerably less than ERA5 suggests.  It would be worth looking at other sites in the southeast, but it's likely that ERA5 has difficulty representing valley-level temperatures in the complex topography of Alaska's southern coast.

Here's a series of charts to illustrate the month-by-month changes in the temperature normals at a variety of sites.  All have the same vertical scale, and the series goes roughly from north to south.  Click to enlarge.


In addition to the well-known autumn warming that is most dramatic in the Arctic (where it is linked to ice loss), it's interesting to see a large temperature increase at Alaska's western sites in February and April - although not in March.  Presumably year-to-year variability is to blame for the March outlier, because after all we're really just taking the difference between two decades: the 1980s and the 2010s.  Taking the late winter period as a whole (February-April), I'd wager that the notable warming is closely linked to loss of Bering Sea ice in just the last few years; 2018 and 2019 in particular had extremely low ice extent, and temperatures were far above normal at the end of winter.

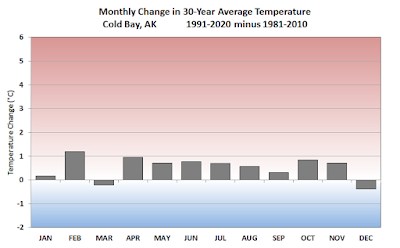
Finally, here's the month-to-month chart for Alaska as a whole.


Tuesday, January 5, 2021

Warm Winter So Far

With winter fast approaching its midpoint, it's interesting to see how the seasonal climate anomalies have stacked up so far, and particularly in comparison to what's expected in a La Niña winter.  In short, it's been warm - indeed, much warmer than expected, with low pressure being a more prominent feature in the Bering Sea than would normally occur with a robust La Niña episode.

Here's a very nice pair of graphics, courtesy of Rick Thoman, showing the November and December temperature departure from normal: click to enlarge.


With few exceptions, the two-month period was significantly warmer than normal; cold in the southeastern third of the state in November was largely outweighed by warmth in December, and November warmth in the northwest more than made up for a localized area of cold in December.

As a reminder, we tend to expect colder than normal conditions across nearly all of Alaska when there's a significant La Niña episode in the tropical Pacific, as there is currently.  The historical tendency is for weaker than normal low pressure (i.e. above normal MSLP) over the Bering Sea and Aleutians in both November and December, and the associated flow pattern often brings a cold northerly component to the flow over mainland Alaska.


But not this year.  November saw exceptionally warm southwesterly flow across western parts of the state, with low pressure over Chukotka, and then in December a strong Aleutian Low flooded nearly all of the state with mild air.


For the two month period, the ERA5 reanalysis shows widespread anomalous warmth, which agrees closely with Rick's station-based maps.

As for precipitation, La Niña tends to be somewhat drier than normal in early winter along much of Alaska's southern coastline, but the southwest has been wetter than normal so far this winter.  For south-central areas and the Panhandle, the maps below show some disagreement between the ERA5 model-based analysis and a station-based analysis from the German weather service (GPCC); but Anchorage has definitely been wetter than normal, and Southeast Alaska has been exceedingly wet (leading to major landslide damage in Haines).  So the ERA5 result looks much more credible here.


It's not just Alaska that has strayed from its La Niña lane so far this winter.  The maps below show a profound discrepancy in Eurasia as well, with the past two months seeing an unexpected trough near the British Isles and a ridge over western Russia.  The pattern that has actually occurred - especially in terms of the Aleutian Low - has been more reminiscent of El Niño than La Niña; and there's no sign of more La Niña-like anomalies returning any time soon.  The obvious question is why; but I'll reserve further comments for another time.