Thursday, May 30, 2024

What Will Fire Season Bring?

Alaska's wildfire season traditionally gets under way in June, and it's an interesting question as to what this year will bring.  Two years ago the fire season was very active (3.1 million acres) despite an entrenched La Niña, and that was an unusual combination; see my early season comments from 2022:

https://ak-wx.blogspot.com/2022/06/wildfire-outlook.html

In contrast, last year we had a strongly developing El Niño, and Canada had its worst fire season on record, but remarkably Alaska's fire acreage was less than 300,000 acres (and most of that was in August).  The 1979-2023 statewide annual median acreage is 482,000 acres.

https://ak-wx.blogspot.com/2023/06/almost-zero-fire.html

The chart below highlights that a majority of very active years have occurred with a warm tropical Pacific phase (positive ENSO or El Niño) in recent decades, but the last two years illustrate how fragile the statistical connection is.


In previous comments on this topic, I suggested that the unusual ocean warmth close to Alaska probably had a lot to do with the 2022 season: this too was highly unusual for La Niña.  If we look at conditions in May leading into the 10 most active fire seasons (since 1979), we see a strong connection to unusual warmth across the Bering Sea and western Alaska - see below.  Bear in mind that fires in May rarely contribute significant acreage to the season's total, so this warm signal is a precursor to the vast majority of the total fire activity in big years.


In years with very low fire acreage, May tends to be cool and damp, with a notable cold signal over the Chukchi Sea, no doubt partly related to higher sea ice in the 1980s.


May 2023 was indeed a lot cooler over the Bering Sea and western Alaska than May 2022.


And how are we looking this year?  May 2024 has been quite cool in Alaska, and notably so in western and southern areas, so it seems there may be a good chance of another subdued fire season like last year.  This would also be quite consistent with the CPC's summer forecast, which points to an elevated probability of significantly above-normal rainfall across interior Alaska, albeit with above-normal temperatures for central and eastern regions:


The May 1 wildfire outlook from NIFC called for "normal wildfire potential statewide from May through August", but given how May has unfolded, I wouldn't be surprised to see an adjustment toward below-normal risk in the upcoming June 1 outlook.


Thursday, May 23, 2024

Early Spring Wet Pattern

I promised to follow up with a few remarks about the wet pattern that has become a recurring theme of early spring (March-April) for western Alaska since 2018.  Rick Thoman pointed out this phenomenon on his blog:

https://alaskaclimate.substack.com/p/is-early-spring-precipitation-higher

As I commented briefly before, it seems pretty obvious that the immediate cause of the wet weather is the vigorous jet stream and storm track into western Alaska caused by a persistent ridge over the North Pacific.  Here's the March-April 500mb height departure from trend, averaged over the last 7 years.


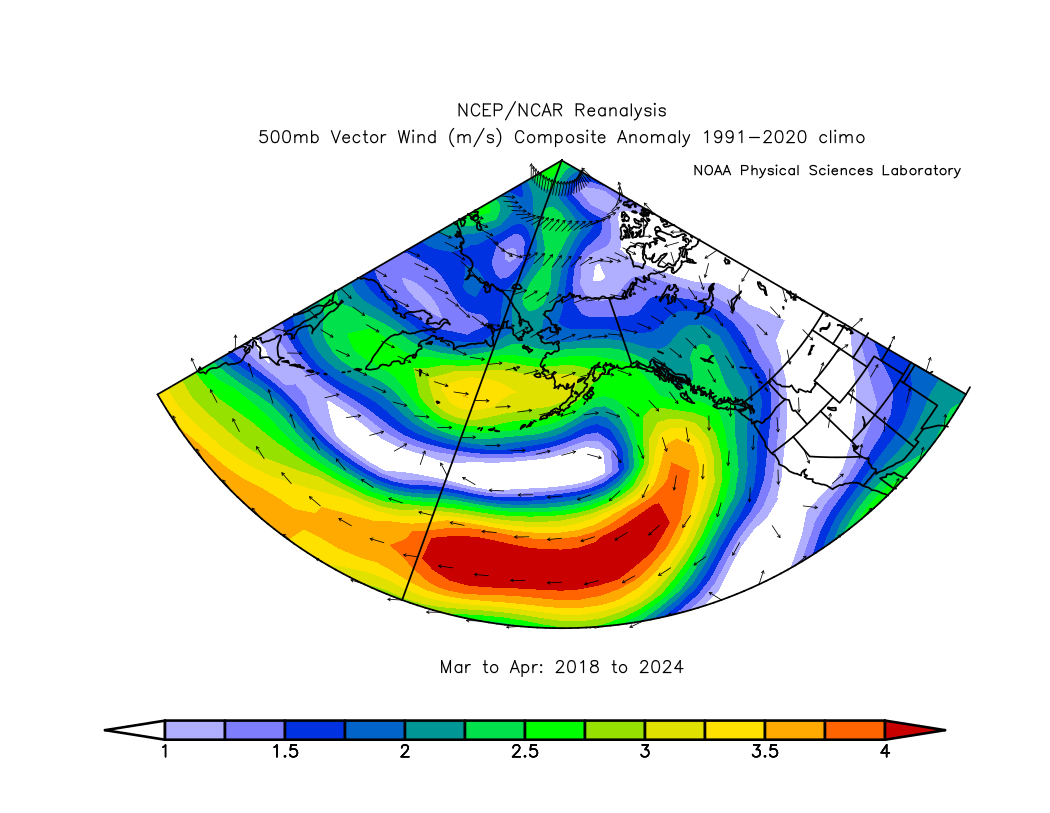
And here's the average 500mb vector wind anomaly (departure from normal): note the stronger than normal westerly flow into southwestern Alaska. 


I decided to look back prior to 2018 for an independent assessment of the relationship between west coast precipitation and North Pacific 500mb height patterns.  Here's the correlation of March-April 500mb height (detrended) with March-April precipitation in Nome:


This certainly supports the idea that a ridge axis from the Sea of Japan to the Gulf of Alaska is favorable for enhanced precipitation in Nome at this time of year.  A trough along the eastern Arctic coast of Russia also tends to be in the mix.  The pattern in the historical analysis implies a southerly wind component across western Alaska, and that corresponds to widespread warmth for western and northern Alaska.


The March-April pattern was slightly different this year, with a more westerly regime and cooler conditions in southwestern Alaska. 


How about sea surface temperatures?  Surprisingly, there's not much historical correlation between Nome precipitation and North Pacific SSTs at this time of year; it seems that early spring precipitation has historically been controlled by the vagaries of the weather pattern much more than by ocean temperatures.


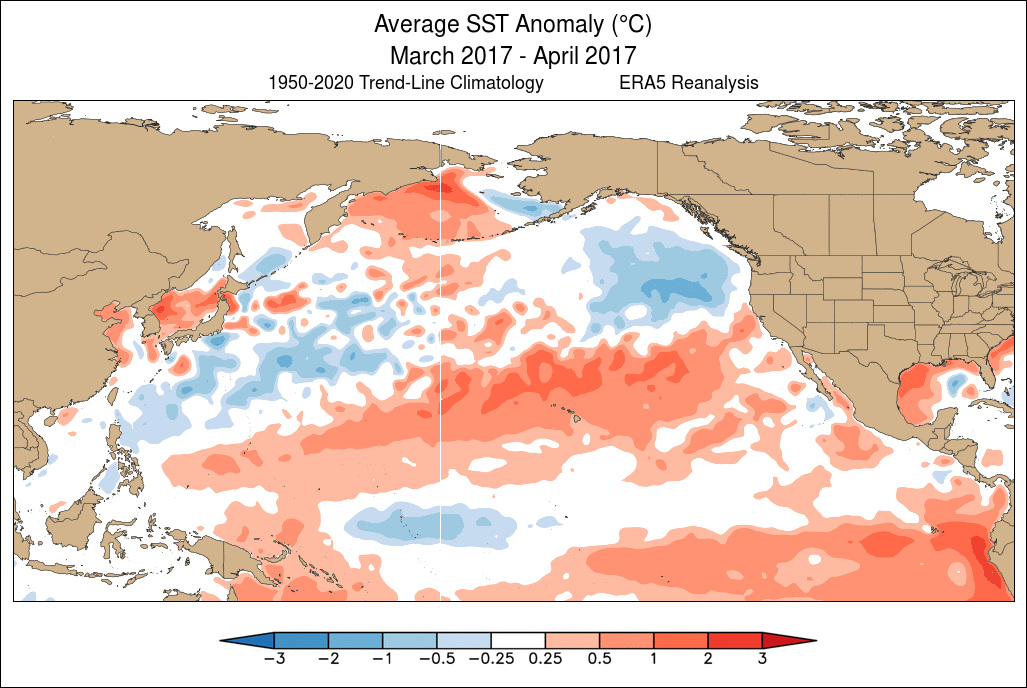
In contrast, however, I think the recurring pattern of the last 7 years is in fact linked to North Pacific SSTs, and strongly so.  Check out the sequence of March-April SST maps below, starting with 2014, when the so-called "blob" of excessive warmth was very much evident in the northeastern North Pacific.  This anomaly was linked to the "ridiculously resilient ridge" over western North America, leading to California drought and other things.  The "blob" pattern evolved into a strongly positive PDO pattern by 2016 in response to the intense 2015-16 El Niño, but then a regime change occurred in 2017-2018 as warmth transitioned to the northwestern North Pacific:


It is remarkable to see how persistent the pattern has become since... yes, 2018.  Here's a summary graphic showing the March-April detrended SST anomaly over the 7 years:


The alignment with the 500mb height anomaly is undeniable:


A really interesting aspect of this is that the warmth from Japan to the waters south of Alaska has persisted more or less unchanged regardless of El Niño and La Niña.  In the sequence of SST maps above, notice the major swings in tropical Pacific SST anomalies.  Normally we expect extratropical SST patterns to respond to ENSO - as in 2015/2016 - but the northwestern North Pacific seems to be marching to a different tune.

As an aside, it's worth noting that the emergence of warmth in the NW North Pacific in 2018 was quite striking at the time, and I commented on it in the North Pacific "blob blog":


Is this just the negative PDO phase that we're seeing in the North Pacific pattern?  Not entirely.  The PDO has indeed been persistently and significantly negative since 2021 - but not in 2018-2019.


A classical negative PDO phase tends to be linked to a trough over Alaska and cool waters from the Bering Sea and Gulf of Alaska to the northeastern Pacific, but the Bering Sea has been generally warmer than normal in recent years (especially in 2018-19), and Alaska hasn't been unusually cold.  Also, a negative PDO is not linked to above-normal precipitation in Nome in early spring.  The following maps show the average March-April pattern when the PDO was strongly negative over the decades.


So what can we take away from this discussion?  I think we can conclude rather confidently that the early spring wet pattern in (especially) western Alaska is linked to the persistent and exceptionally unusual North Pacific warm zone stretching east from Japan that emerged in 2018.  This developed in tandem with atmospheric ridging that both reinforced and was reinforced by the SST anomaly, and the atmospheric circulation anomaly has produced a storm track into western Alaska.

As for the deeper cause of the North Pacific anomaly, we can attribute some of it to the negative PDO phase (i.e. natural multiannual/decadal variability), but the excess warmth from the Bering Sea to the Gulf of Alaska is unexplained.  It feels like a new angle on the multi-year northeastern Pacific warm episode that developed in winter 2013-14, although the new warm zone now has a much greater duration.  I also have a sense that the new regime is related to "Arctic amplification" of the global warming trend, but this is speculation; presumably at some point the North Pacific pattern will shift again.

Finally, a question for next time: how else has the 2018 regime shift affected Alaska climate?  It will be interesting to look for other climate anomalies that developed at the same time, but for other locations and at other times of year.

Saturday, May 18, 2024

Strong Bering Sea Storm

Rick Thoman pointed out that an unusually strong storm made its way across the northwestern Bering Sea earlier this week.  Here's the surface analysis from 4pm AKDT Wednesday, courtesy of Environment Canada, with a red circle indicating the location of St Lawrence Island.  Click to enlarge.


The storm's minimum MSLP was estimated to be 974mb as it passed west of St Lawrence Island, and it "made landfall" in eastern Chukotka at 977mb.  This is unusually low for the time of year - in fact, it's the lowest MSLP on record (1950-present) anywhere in the northern Bering Sea for this late in the season.

To illustrate this, the map below shows the 1950-2023 minimum MSLP for May 11th through the 31st, based on ERA5 data.  The record low values from the northern Gulf of Anadyr across to the northeastern Bering Sea and Norton Sound are 980mb or above; so this was a record strong storm for this late in the season (the June record values are higher). 


Are strong storms becoming more common at this time of year in the Bering Sea?  Not at all.  Interestingly, the trend is the opposite: here's the annual series of May minimum MSLP in a box that approximates the northern Bering Sea.  Note that this is for all of May: there have been stronger storms than this week's event in the first week of the month.


The trend is statistically significant at a fairly high level (R=+0.28, 74 years), and it makes this week's event all the more notable.  But admittedly there is some uncertainty in the reanalysis data, especially for the earliest years (pre-1958, in particular).

Looking at trends in monthly minima through the year, spring stands out as a time with positive trends, i.e. less extreme storms over time, whereas February shows a trend for increasingly strong storms.


The time series for February again has a significant trend, and indeed the change around 1990 does look real.  I don't have an explanation for these trends.


Monday, May 13, 2024

April Climate Data

Looking back at April's climate anomalies, the mid-atmosphere circulation around Alaska was dominated by the contrast between a big east-west ridge stretching across the mid-latitude North Pacific and a strong trough to the north, over the eastern Arctic Ocean.


The ridge was closely linked to ongoing very warm SSTs from the Sea of Japan to the waters south of the Aleutians.  That oceanic warm anomaly has been entrenched for well over 3 years now, reflecting a negative PDO phase (even though the waters close to the North American coastline aren't particularly cool).


The strong north-south pressure gradient across Alaska in April produced unusually strong westerly flow, and that manifested itself in - yet again - very wet conditions in western Alaska.  It was the 4th wet month in a row from the southern Seward Peninsula southward across the Y-K Delta and down to around Cold Bay, according to ERA5 data.  In contrast, southern parts of Southeast Alaska have been unusually dry every month this year so far.


The statewide April temperature wasn't too unusual in the end, although there was a lot of up and down during the month.  Eastern Bristol Bay, the upper Alaska Peninsula, and Kodiak Island were colder than normal, but most of the east and north was warmer than normal, representing the western edge of a vast area of warmth extending across most of the continent.  The spatial pattern across both Alaska and the continent was very similar to the September-December average: compare the maps below.


April's unsettled weather in western Alaska also involved above-normal wind and cloudiness - also similar to recent months.


The persistently wet weather in western Alaska is more than just a quirk of 2024.  Rick Thoman shows in his latest blog post that most years since 2018 have seen unusually high precipitation from western Alaska to far eastern Russia in March and April, and the anomaly is becoming very statistically significant:


I'll take a stab at possible causes for the recurring wet pattern in a future post, but for now here's the average 500mb height anomaly in March-April of the last 7 years.  Looks like the oft-recurring North Pacific Ridge is a big factor...


Friday, May 10, 2024

Cold and Snow

Here's a bit of follow-up on the unusually late cold and snow.  According to Rick Thoman (and relayed via Brian Brettschneider on Twitter), Monday's half-inch of snow in Fairbanks was the first time since 1978 that measurable snow occurred after green-up.

The late snow in 1978 was much later - May 27 - but it was also more marginal, with mixed rain and snow reported, and officially-measured accumulation of only 0.1".  A more legitimate late snowfall occurred in 1966 in Fairbanks, with 1.6" measured on May 15-16; that was 8 days after breakup at Nenana, and almost certainly after green-up too (although the NWS green-up history only goes back to 1974).

Not to be left out, Anchorage also saw accumulating snow on Wednesday night.  This is a top-10 latest date for snow, and it's actually the latest on record with measurable snow on the ground at the daily observation (data back to 1953).  The previous record was May 6, 1955.  Interestingly last year there was snow on the ground on May 4.

The cold hasn't stopped breakup from proceeding, however.  The ice went out on the Yukon River at Tanana on Wednesday, and the Kuskokwim tripod at Bethel stopped the clock on Wednesday morning, despite a temperature of 25°F with snow falling.  Unfortunately significant flooding is now occurring in Bethel and elsewhere on the lower river, as the ice is jammed up downstream.

https://www.kyuk.org/public-safety/2024-05-09/as-lower-kuskokwim-river-breaks-up-bethel-sees-highest-river-gauge-level-in-almost-20-years


On the other side of the Arctic, very unusual cold is also affecting western Russia; it was snowing in Moscow yesterday for their big parade.  Severe freezes have also occurred in the Baltic states in recent days - a rare event for this late in the season.  As I commented in my last post, I think the "perturbed" flow pattern can be traced back to the lingering circumpolar disruption caused by the March stratospheric warming event.