Sunday, November 28, 2021

La Niña Follow-Up

As very unusual cold persists in western and south-central Alaska this weekend, it's worth revisiting a statement I made in last Saturday's post about the typical impacts of La Niña on Alaska winters.  I suggested that Alaska gets more cold out of La Niña than might be expected from temperatures aloft (well above the surface), because of a propensity for clear skies and calm winds that facilitate surface cooling.

After taking a quick look at some data, I'm no longer as confident about this, although more could be done to examine the hypothesis.  Consider the chart below, showing the relationship of Fairbanks surface (2m) temperature to 1000-500mb thickness in December through February.  (1000-500mb thickness is a good measure of the average temperature in the lowest half - by mass - of the atmosphere.)


The correlation between temperature and thickness is high, and it's clear that strong La Niña events tend to produce cold winters.  However, there is no compelling departure from the overall relationship during La Niña.  I was expecting to see surface temperatures lying mostly below the trend-line for La Niña winters, which would have indicated that the surface is systematically colder than temperatures aloft would normally dictate.  But in fact it looks like surface temperatures are generally in line with upper-air temperatures; La Niña winters are - on average - equally cold aloft and at the surface in Fairbanks.

On the other hand, there is a slight hint that the strongest El Niño winters are a bit warmer at the surface than would be expected, with only 3 of 10 strong El Niño winters lying below the trend-line, and 6 of 10 above.

In an ideal world, the next step would be to look at wind speed and cloud cover data from Fairbanks, but the long-term historical record is not really suitable for this kind of analysis over many decades, because instrumentation and measuring practices have changed.  Gridded reanalysis data is probably a better bet, and ERA5 does show an indication that strong La Niña winters are often less windy than strong El Niño winters across the central and northern interior - see below (La Niña top, El Niño bottom).  But it's a rather weak signal that reverses sign for south-central Alaska, and Fairbanks is close to the transition zone.


As for cloud cover, I only looked at ERA5 solar radiation, and of course the big caveat here is that the December-February signal is largely dominated by February.  With that said, it looks like clear skies are indeed slightly favored near Fairbanks in strong La Niña winters, but again the signal is weak.  ERA5 does have a cloud cover variable, but I haven't obtained that data yet.


So in summary, my hypothesis about cold being focused at the surface during La Niña winters can be put on hold, although I'd like to dig in a bit more before dropping it completely.

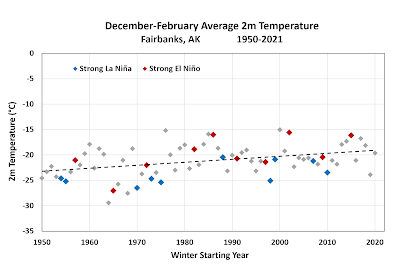
As an aside, the charts below show the 70-year history of Dec-Feb surface temperatures and 1000-mb thickness, with the strong ENSO years indicated.  The ENSO state is actually more strongly correlated, in a linear sense, with thickness than with surface temperature, and the charts confirm this: there's almost no overlap between the opposite ENSO states in terms of 1000-500mb thickness (when compared to trend), whereas several of the winters were near-trend in terms of 2m temperature.  In particular, strong La Niña apparently provides a high probability of notably below-trend thickness.


Tuesday, November 23, 2021

Record Cold November in Places

With very unusual cold persisting in southwestern Alaska, and even colder conditions arriving in the next few days, some spots with longstanding climate histories appear likely to break their records for coldest November.

For example, assuming the NWS forecast is correct for the rest of the month, King Salmon will end up with a monthly mean temperature of about +4°F, compared to the 1963 record of +8.4°F (data since 1942).  With such a large margin of difference, it seems very unlikely that the record won't be broken - as noted by Rick Thoman.  Temperatures in recent days have been colder than anything seen last winter, and are not too far off the coldest that is typically seen throughout an average winter at this location.


Looking at data from Bethel, which has a period of record back to 1923, it looks like November 1939 was colder than November 1963 in the region, but the NWS forecast suggests Bethel still has a chance of breaking the record.  Currently it seems the monthly average may end near 0°F, with the 1939 record standing at +0.1°F.  This is quite a bit colder than the average January in Bethel (only 5 Januarys have averaged below 0°F since 1976).

How about Cold Bay, with data back to 1950?  The November 1963 record is 28.4°F, and we're currently looking at 28.1°F for this month's average.

Anchorage currently looks unlikely to break its monthly record of 9.4°F, set in 1955.

If records are broken at several sites, this would be the first winter month since January 2012 with widespread monthly cold records at longstanding climate sites in Alaska.  March 2017 saw record-breaking cold in Haines, and April 2013 was record cold in the interior, but other than that warmth has been the oft-repeated theme.


Saturday, November 20, 2021

Cold Descends - Thank La Niña

It's been a very cold week for the time of year in western and southern Alaska, and the eastern interior is now seeing its first real cold of the season, with an impressive -44°F at Northway this Saturday morning.  Chicken also saw -44°F last night.  Here are a few of the coldest readings in the past several days:

Tuesday Nov 16
Bettles   -35°F
Wiseman   -35°F
Denali Visitor Center   -28°F

Wednesday Nov 17
Norutak Lake RAWS   -32°F
Kaltag   -31°F
Unalakleet -31°F

Thursday Nov 18
Selawik 28E  -31°F
Ruby 44ESE  -29°F

Friday Nov 19
North Pole 1N  -34°F
Tok #2  -34°F

Wednesday morning's -31°F at Unalakleet on the Bering Sea coast is really impressive, with an easterly breeze making it feel even colder.  Unalakleet climate data is patchy after 1977, and non-existent after 1997, but there is good data from 1944-1977, and the earliest -30°F in all those years was November 22.

The upper-air observations from Fairbanks reported an 850mb temperature of -25.3°C on Wednesday morning, which is the earliest -25°C at 850mb since the remarkable pre-Thanksgiving cold snap of 2011.  On that occasion, Fairbanks saw -41°F on the 17th, and the 850mb temperature reached -30°C on the 21st.  Read about it here and in other posts from that month.

In terms of departure from normal, the greatest temperature anomalies have been in the southwest.  Here's a simple animation of approximate daily departures from normal in the last week (based on model data):


The southwestern mainland is where cold is most reliably seen in Alaska during strong La Niña winters, as illustrated by the map below; this shows that all of the 10 strongest La Niña's since 1950 produced below-trend December-February temperatures in southwestern mainland Alaska.


The intensity of the current La Niña is admittedly up for debate, because it depends on how intensity is defined, but these days I prefer to watch the Multivariate ENSO Index, which uses five different variables to measure the phase of ENSO.  The map above shows results for the 10 most negative MEI values in November through March, and the current MEI is running at about 7th most negative since 1950.

Why does La Niña tend to bring cold to Alaska?  The answer is that La Niña involves a westward shift in the semi-permanent zone of frequent heavy rainfall over the western equatorial Pacific and the Maritime Continent, and this has predictable impacts on the atmospheric circulation at higher latitudes over the North Pacific.

The two maps below show the 200mb (jet stream level) wind during strong La Niña winters (top) and strong El Niño winters (bottom).  While the jet stream maximum near Japan remains basically the same - the basic north-south temperature gradient doesn't change that much - there's a major difference in how far east the jet extends, and this is linked to the longitude of peak tropical rainfall (westward for La Niña, eastward for El Niño).  In particular, the jet stream is stronger across the central and eastern North Pacific during El Niño.


The jet stream differences are connected to subtle but important shifts in the average circulation near Alaska: compare the 500mb maps below (mid-atmosphere level, La Niña top, El Niño bottom).  There's always a trough over northeastern Asia on average during winter because of the basic temperature gradient (it's always cold in winter in Siberia), but La Niña keeps the trough focused near the Sea of Okhotsk, while El Niño brings the trough farther east and strengthens it in association with the stronger North Pacific jet stream.  


The difference between the two states is easier to see if we look at anomaly maps, i.e. departure from normal:


During La Niña, the tendency for above-normal height (pressure) near the Aleutians - which is equivalent to a weakening of the usual trough - means that cold northerly flow has a better chance of reaching Alaska.  The average flow aloft still has a southerly component (which is why Alaska isn't as cold as it could be in winter, considering its latitude), but the southerly component is lessened compared to normal.  The maps below show average wind at 500mb (La Niña top, El Niño bottom)


Also, and I believe this is significant, La Niña's weaker trough means a higher frequency of clear skies and calm winds, which strongly promotes surface cooling; I suspect Alaska gets more cooling out of La Niña that we would expect from upper-air temperatures alone.  It would be worth examining this idea a bit more for a subsequent post.  Here's the average MSLP in the two contrasting patterns: lots more storminess from the Aleutians to the Gulf of Alaska in El Niño winters (bottom).


As an aside, El Niño's impacts on Alaska aren't the opposite of La Niña's effects; the climate response is non-linear and asymmetrical.  Unusual warmth in El Niño is traditionally confined to the southeastern half of Alaska (see below), although the last major El Niño in 2015-16 was an exception, with extraordinary warmth across most of the state.


Friday, November 12, 2021

October Climate Anomalies

First, a brief follow-up on the last post: we ended up with 15 consecutive days without Nome being warmer than Fairbanks, which is quite amazing for the time of year.  Based on 90 years of climate data, the record for a sequence of such days ending in November is only 7 days, which occurred in 1956.  There were 10 such days leading up to Christmas in 1959.

Something like normalcy has now returned for Fairbanks, as much colder air arrived aloft over the interior, allowing surface temperatures to drop to more seasonable levels.  It's still cold in Nome, though - and notably cold around the northwestern interior: quite a number of locations dropped into the -20s there this morning.
The Tanana River at Nenana looks to be mostly frozen over - at last.


Looking back at October, here are the climate division temperature and precipitation ranks, courtesy of NOAA/NCEI:


Below is Rick Thoman's temperature anomaly map for the month.  Notice that the cold departures in the southeast, though small in absolute terms, amounted to one of the colder Octobers in the last 30 years (compare with the map above).


The large warm anomalies in the northern interior are interesting, and it's good to see that this quite localized feature is reflected in the ERA5 data:


Enhanced cloud cover seems to have had something to do with this warm anomaly, and this in turn was related to unusual low pressure from Alaska to northwestern Canada, and an extensive trough from eastern Russia to the northeastern Pacific: see below.  It was a very unusual circulation pattern with really exceptional, record-breaking warmth over much of central and eastern Canada; the northern interior warmth in Alaska was right on the western edge of the continental-scale anomaly.


Here are the ERA5 maps for some other variables:


Finally, given that we're talking about October, it's worth checking in on Utqiaġvik, where the loss of sea ice has so profoundly changed the temperature climate for the month.  This October was a little cooler than in the last 5 years, but still way above the norm from earlier decades.


Saturday, November 6, 2021

Cold West, Warm East

The recent weather pattern, with a persistent trough over far eastern Russia and the Bering Sea, has allowed winter to make an appearance over western Alaska, while central and eastern areas have been much warmer.  The contrast reached an extreme last weekend, as deep southerly flow and a major chinook brought excessive warmth to the eastern interior.

Remarkably, it has been almost two weeks since Fairbanks had a daily mean temperature lower than Nome, and this is very unusual indeed for the time of year.  Typically the interior cools off much more quickly in late autumn than the west coast, owing to the strong maritime influence in the west and the lack of ice in the Bering Sea.  Because of this, early November is the time of year when Nome is most likely to be warmer than Fairbanks, i.e. the opposite of what's happening this year.


In the first half of November, Nome is warmer than Fairbanks on 87% of all days, according to the 1930-2020 history, and in recent years this percentage has risen still higher, as the Bering Sea has been so warm.  For instance, in the past decade only 12 days between Nov 1 and Nov 15 have been as cold or colder in Nome than Fairbanks, i.e. 8% of all days in that window; and yet we are currently standing at 12 such days in a row.  Here's a chart of daily mean temperatures, and their 1981-2010 normals, in the two locations since September 1.


The freeze-up situation reflects the unusual contrast: there has been lots of ice on the Yukon out west for days now, but the Tanana River still shows mostly open water.  Here's a webcam photo of the Yukon at Grayling from more than a week ago, versus the Nenana webcam today:


The notorious cold spot of Chicken has only dropped to -4°F so far this season, a far cry from last year, when -40° was reached more than once in early November.  Looking at a map of the lowest temperatures since October 1 (click to enlarge images below) shows many locations yet to see 0°F or even single digits Fahrenheit from Nenana to Fairbanks and in the Yukon-Tanana uplands.


Here are a few 500mb maps to illustrate the circulation pattern, including the remarkable chinook last weekend.  Note the persistent trough over far eastern Russia: an anchor point for the cold air mass that has been entrenched over western Alaska.

3am AKST Oct 26:

3am AKST Oct 31:

3am AKST Nov 5: