Monday, April 30, 2018

Snow in the Hills

Spring suffered another setback in the interior today, as a round of steady precipitation brought the snow line down to valley-level in the Fairbanks area for a few hours.  Mixed rain and snow was reported from the airport during the morning hours and there was a brief threat of a fresh snow cover at UAF:


Snowfall of 2-4" was reported from the hills, according to the NWS, and temperatures have been below freezing all day above about 2000'.  The webcam views from Cleary Summit showed the Steese Highway becoming snow-covered between 5 and 6 am this morning:


However, the road surface cleared off by mid-morning (10:30 in the image below) under the influence of solar heating despite thick cloud cover and ongoing snowfall.


As Rick noted the other day, this spring is turning into something of a cool one relative to recent norms, although it's been more notable for the lack of warmth than the occurrence of unusual cold: there have been only 2 days above 50°F so far this year, compared to 12-22 such days by the end of April in the past 4 years.  This April's mean temperature has been below freezing in Fairbanks for the first time since the record cold April of 2013, but for most of the 20th century it was more common than not to have a sub-freezing monthly mean in April.


More chilly and damp weather, with snow in the hills and probably in town too, looks rather likely in the next couple of days.  It's unusual to see lengthy spells of rain and snow at this time of year - the chart below shows that the long-term frequency of rain or snow reaches its seasonal minimum in early May, based on hourly reports from Fairbanks airport since 1950.


This morning's 500mb chart shows a very typical set-up for wet weather in Fairbanks-land: vigorous flow out of the west-southwest in the middle levels of the atmosphere.


Saturday, April 28, 2018

When will it warm-up in Fairbanks? Adjusting Climatology for Trend

Hi, Rick T. here with some ideas on how we can use the historical record (i.e. climatology) in the face of significant trends. What I want to look at in this post are estimating threshold exceedance dates, e.g. first or last date in the season of the temperature exceeding some threshold. This is very commonly available for freeze dates, such as this plot of the probability of first date of freezing temperature at Fairbanks Airport in autumn (courtesy of the Western Regional Climate Center), but of course can be constructed for any threshold of interest. However, an underlying assumption for the use of this kind of information for planning or forecasting is that the past is a reliable guide to the future, i.e. there are no significant trends. 


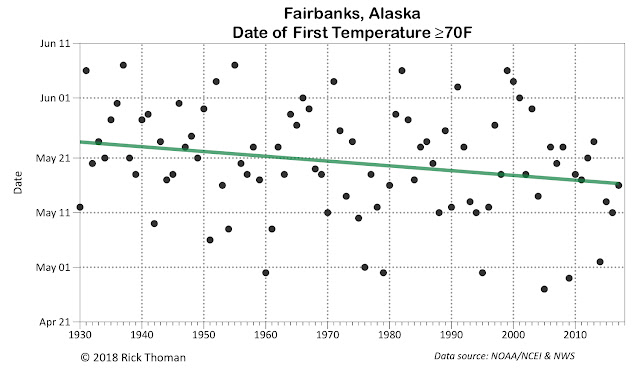
The high temperature so far (through April 27) at Fairbanks Airport has been 54F. This is only slightly lower than average for the historical record, but is notably low for recent years: only four springs in the past 30 years have had a lower high temperatures at this point in the season. So when is going to really get warm? Or at least, when can we expect to get warm based on the usual annual cycle? We of course turn to climatology. The first thing we can do is construct a plot like the one above just based on the historical data. From this, we see that the median date of the first 70F is May 21, and any day between May 15 and May 25 would be pretty typical, while dates before May 7th or June 1st would be quite unusual.

However, when we plot the first 70F of the warm season as a time series, we see that the the first occurrence of 70F has been occurring, on average, earlier in recent years, as the the linear regression trend line slopes downward (and is statistically significant at the 95% confidence level), with the typical first 70F now about week earlier than in the 1930s.
So how could we adjust our cumulative distribution plot to account for the trend? If we assume that the variablity remains the same, and that looks like a reasonable assumtion in this case, then it's pretty easy:
  • First detrend the observed dates by, for each year, subtracting the regression value from the observed. This leaves us with the regression residuals. 
  • Next, take the regression estimate for the present (in this case May 16th) and add that back into the residuals. This in effect "converts" the historical record to the current climatology.
  • Last, construct a cumulative distribution plot on our "converted" data. 
When we do that, it makes a significant difference because of the trend:
So based on our present climate, we would estimate that there is about a 30% chance of having the first 70F temperature in Fairbanks before May 12th, whereas using only the historical record we would estimated less than a 20% chance. Similarly, the chances of getting through May without having a 70F or higher temperature is now less than 5%, half of the historical-only estimate. Is any of this meaningful? That of course depends on your needs.

Putting it all together, here is the final graphic, with the cumulation distibution plots for 60F, 70F and 80F temperatures adjusted to reflect the probablies of exceedance based on today's reality and not on a different past.


North Pacific Forecast

A couple of months ago I wrote a post on the very unusual warmth that the seasonal forecast models were expecting across the North Pacific this summer.  It was a long-range forecast at the time, but as summer draws nearer the models are not backing off.  The two maps below show a comparison of the February (top) and April (bottom) forecasts for June-August mean sea surface temperature departure from normal; the message is very similar, with the models expecting very anomalous warmth in the north-central and northwestern North Pacific.


As noted in the previous post, the forecasts are consistent with a strongly positive phase of the North Pacific Mode (NPM); here's a chart showing the NPM index values that the models are expecting.


 We've seen in the past that the NPM phase is correlated with winter precipitation patterns across interior and northern Alaska, with above-normal snowfall often occurring when the NPM is positive.  But what can we say about potential impacts for the next few months?  Looking at Fairbanks first, the charts below show the historical relationship of the NPM index with May-July mean temperature and total precipitation.


There's a slight but barely significant tilt towards cooler temperatures at this time of year when the NPM is more positive, but the precipitation chart is perhaps more interesting as it hints at a non-linear relationship.  It appears that the positive NPM phase tends to favor either very wet or very dry weather in Fairbanks, as the 6 driest years and several of the wettest years (in May-July) occurred with a positive NPM phase; but near-normal rainfall is somewhat more likely when the NPM is negative.

Recent years have borne out the wide variation in summer rainfall amounts during a positive NPM phase, as 2013 was very dry (and extremely warm), but 2014 brought record summer rainfall.  Both summers had a strongly positive NPM phase.

The map below shows the typical 500mb height pattern for positive NPM years when dry weather prevails in Fairbanks; not surprisingly the most common location for high pressure is over the eastern interior.


In contrast, years with a positive NPM phase but wet May-July weather in Fairbanks have the ridge axis located farther to the southwest, and importantly these years have an active trough over the Chukchi Sea; so this pattern favors strong westerly flow that brings wet frontal systems across the state.


From a North Pacific-wide perspective, the two patterns are rather similar, but the differences are crucial for rainfall in interior Alaska.  The maps below show the precipitation patterns associated with the two sets of positive NPM years.


So which pattern should we pick to accompany this summer's expected North Pacific warmth?  Well, the seasonal forecast models are clearly choosing the wet option, as a rather strong majority of the NMME ensemble members are showing significantly above-normal precipitation across western and northern Alaska.


The Climate Prediction Center is also going for wet, and the signal is a strong one for western Alaska; it's unusual to see 50+% probabilities of upper-tercile precipitation in the seasonal forecast.


There seems to be little reason to disagree with the strong model signal - it's usually unwise to do so - but just for fun I pulled up the May-July patterns that occurred in past years when Bering Sea ice was very low in the preceding winter (although nowhere near as low as this year): see below.  The sea-level pressure pattern (top map) supports the idea of low pressure over the Arctic waters north of Alaska, but there's also a high pressure signal over most of the state, and interestingly these years were more dry than wet in the interior.


There's obviously more work that could be done to pick apart the varying ways that North Pacific SSTs interact with Alaska's climate at this time of year, but I expect we'll learn something just from watching the pattern unfold in the next few months.  A wet summer seems more likely, but the historical NPM analysis suggests that it could go the other way - and so I think there is a bit more uncertainty about the forecast than the models and CPC would suggest.

Tuesday, April 24, 2018

When Will The Tripod Go Out?

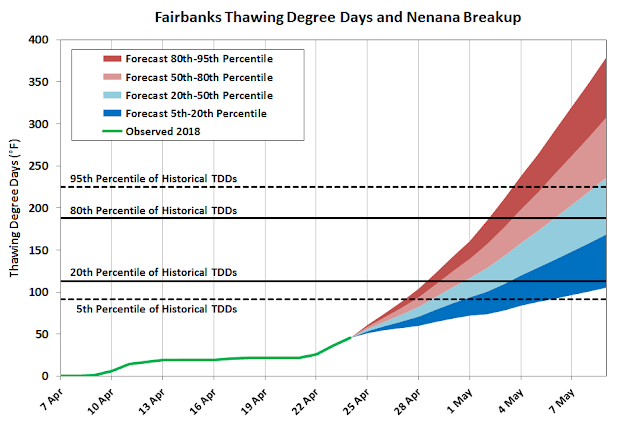
The spring thaw is getting under way in earnest this week across the interior, so breakup will soon be in full swing.  It's an interesting little exercise to try to pinpoint when the tripod may go out at Nenana, based on the 15-day forecast combined with the historical range of heat units that have been required to produce breakup in the past.  Rick Thoman has produced this kind of analysis for predicting greenup in Fairbanks, so credit goes to him for the idea.

The chart below shows the latest outlook.  Note that we're using temperatures in Fairbanks, not Nenana, because of the long-term history in Fairbanks.  The green line shows the observed accumulation of thawing degree days (excess of daily mean temperatures above 32°F) so far this year in Fairbanks (through today), and the colored fan indicates a realistic probability distribution of future TDDs based on today's ensemble forecast for the next 15 days (courtesy of NOAA's EKDMOS product).  The horizontal lines show several percentiles of the historical TDDs that have been observed up to and including the date of breakup in the past (1930-2017).


According to the analysis, there's little chance that Nenana's tripod will go out before Saturday - even if the weather is warmer than expected, and the river breaks up "easily" (i.e. with less thawing than usual), the earliest we might expect breakup is Saturday, April 28.  It's more likely that the date will be April 29 or later, and it seems quite likely that it won't be until May 1 or later.

However, I would make one cautionary note: with snowpack being well above normal this year, runoff will be greater than normal, and this should bring the date forward a little.  The Tanana river ice is also rather thin at Nenana, but ice thickness is not a strong predictor of breakup date.  With all things considered, I'll go for April 30 - May 2 as the most likely 3-day window of dates.

Saturday, April 21, 2018

Cold Spring Day

Yesterday was a very chilly day for the time of year across interior Alaska, with breezy below-freezing conditions all day in most areas north of the Tanana and lower Yukon rivers.  Temperatures struggled to reach 20°F in the Yukon Flats despite plenty of sunshine, and Fairbanks only made it to 31°F.

The last time the daily high temperature was below freezing this late in the season in Fairbanks was during the record cold April of 2013 - you can read all about that in the blog archives here (Rick Thoman was the author then).  Prior to that it had been more than 10 years since a sub-freezing day in late April (2002).

The winds did not go calm last night, but temperatures dropped off sharply nonetheless, and on the North Slope this morning's temperatures were, well, Arctic.  Umiat made it to an impressive -27°F with still a light breeze this morning.  This is cold even by Umiat standards; in the combined history of data from Umiat sites, only 4 years were this cold so late in the season (but 1984 takes the cake, with -43°F on April 23).

Here are 24-hour low temperatures as of 5pm AKDT today:


To add insult to injury yesterday, a couple of inches of snow fell in parts of Fairbanks in the evening.  The airport's total of 1.8" was the most to fall this late in the spring since - you guessed it - 2013.  A 5-year return period is very consistent with the long term history for this kind of event, although there have been occasions with 6" or more at this late date or even into May.

The scene down on the Tanana River at Nenana was not encouraging for those with money on a very early breakup, and this morning looked less than spring-like at UAF:


The culprit for the renewed bout of winter was a sharp upper-level trough extending southwest from a cold low that dropped south to near Canada's northwest coast a couple of days earlier.


Thursday, April 19, 2018

Sea Ice Update

One of the biggest Alaska-related climate stories of this winter has been the dramatic reduction in Bering Sea ice compared to recent decades (and probably much longer, as noted by this recent article on climate.gov).  The latest data show no late-season recovery, and in fact the ice extent deficit has "stabilized" at more than 500,000 km2 below normal.  As of April 18, the Bering Sea ice extent of just 142,000 km2 is equivalent to the 1981-2010 normal for the beginning of June.


In seeking an explanation for the absence of sea ice, I previously noted the role of reduced northerly flow.  The connection between Bering Sea ice and the local circulation pattern is also reflected in the following map, which shows the correlation between 500mb heights and sea ice extent for December-March.  When there is a strong trough over Alaska, Bering Sea ice expands, but when the winter is dominated by a ridge over Alaska, ice cover is reduced.  Not surprisingly, this winter's upper-level height pattern was very similar to the pattern that produces strong variations in Bering ice extent - see the second map below.


An interesting question that arises is "to what extent can this winter's ice loss be explained by the flow pattern?"  We can address this in a simple manner by estimating a linear relationship between sea ice extent and 500mb heights at the epicenter of (inverse) correlation near 65°N 160°W.  The chart below shows the reasonably good relationship (R=-0.67) and indicates that this winter's 500mb heights were the highest in the modern era of sea ice data.  However, the ice extent was clearly well below the level that would be expected solely from the strength of the ridge.


The chart below shows the same data in time series form.  This winter's 500mb heights were not much higher than in some recent years, but sea ice extent was far lower.


Performing the linear regression allows us to quantify the unusual shortfall of ice relative to what would might be expected from the flow pattern; see below.  Based on 500mb heights alone, the expected value of Bering Sea ice extent for 2017-2018 is 423,000 km2, or 168,000 km2 below the 1981-2010 mean.  The actual deficit this winter was 364,000 km2, or more than twice what can be explained by the circulation pattern alone.


Perhaps the most interesting aspect of the analysis is that there has been an ice deficit relative to the regression model in each of the last four years, and it has grown steadily; here are the ice extent residuals from the last four years:

2014-15   -60,000 km2
2015-16   -107,000 km2
2016-17   -128,000 km2
2017-18   -195,000 km2

These results are consistent with the idea that the sea ice loss is not simply an expression of unusual weather patterns; rather, sea ice deficits have increased owing to persistent regional ocean warming and, presumably, Arctic-wide amplification of the background warming trend.

Saturday, April 14, 2018

April Temperature Variance

Fairbanks saw its first 50°F temperature of the spring on Wednesday, and this was right on schedule according to the long-term history.  Based on data since 1930, the median date is April 11, but the first 50°F has typically arrived a few days earlier in recent decades.

Here's a chart of average daily high temperatures in each April since 1930 (blue markers) along with the date of the first 50+°F temperature (red markers).  Note that I've excluded 3 instances when 50°F occurred prior to March (1943, 1981, and 2009); these were exceptional winter chinook events, and for today's analysis I'm interested in what happens during spring.


The month of April has seen pronounced long-term warming in Fairbanks, with the linear trend line showing more than 5°F of warming over 87 years.  It's no surprise, then, to see that the first 50°F has become slightly earlier - although there's only a weak trend in the date of first 50°F.  The trend in April mean high temperature is highly significant (p<0.01), but the first 50°F trend is not significant at all (p~0.20).

At first glance it's surprising that the first 50°F trend is so much less robust, but this is partly because the variance of 50°F dates is so large.  Over the 87 years, the first 50°F date has advanced about 4-5 days, but the standard deviation is about 3 times as large (14 days).  In contrast, the interannual standard deviation of mean April high temperatures is almost exactly the same as the 5-6°F of warming that has occurred, so the long-term change has produced a very significant shift in the frequency distribution of mean temperature.

If we consider the normal rate of warming at this time of year in Fairbanks, we find that 5-6°F of warming is equivalent to about 8 days of climatological warming.  Naively, then, we might have expected the first 50°F to have advanced about 8 days; but even that would not correspond to a statistically significant trend in the date.  The fact is that the variance of the first 50°F date is so large that sampling variability could plausibly produce trends that are nearly zero or trends that are much greater than expected.  And so we might say that dates of "first warm day" or "first cold day", at least in Fairbanks, are not particularly useful as indicators of long-term change.

Tuesday, April 3, 2018

Another Warm Winter

For the fourth time in the past five years, the November-March mean temperature in Fairbanks was significantly warmer than the 1981-2010 average, i.e. the mean temperature was in the upper tercile of the 1981-2010 distribution.  Each calendar month was also warmer than normal, and in fact this warm "streak" goes back to last June; each of the past 10 calendar months has been at least 1°F warmer than normal.  This kind of persistent warmth is not unprecedented, but it's certainly unusual.

The chart below shows running annual mean temperatures (daily max/min/mean) in Fairbanks since the beginning of the NWS/Weather Bureau era.  The recent warmth has raised the annual mean to nearly 32°F, a threshold that was exceeded for part of 2016.


It's interesting to note that some very cold years in Fairbanks had annual daily maximum temperatures below freezing, but that hasn't happened for many years.  Also of note: the long-term trends in maximum and minimum temperatures are quite similar over the entire period, but minimum temperatures increased more dramatically in the climate shift of 1976-77.  Consequently, the linear trend in minimum temperatures since 1976 is actually negative (-0.15°F/decade), but daily maximum temperatures have continued to increase (+0.20°F/decade).  Of course we have to take these numbers with a grain of salt owing to location and instrumentation changes in the official climate record.