Monday, December 31, 2018

Warmth Since June 2013 - Part II

A couple of weeks ago I wrote about the remarkable persistence of unusual warmth in Alaska ever since the sudden and dramatic change in early summer of 2013.  As promised then, I'd like to take a look at the larger climate patterns that have prevailed in the Northern Hemisphere over the same period; this will give us a sense of the broader context for Alaska's experience and perhaps also suggest potential explanations for the change.

First, the map below (click to enlarge) shows the percentage of calendar months since June 2013 in which the average temperature has been above the 1981-2010 normal, according to NCEP/NCAR reanalysis data.  This isn't the most robust data set in the world for long-term temperature trend analysis, but it's OK for a quick look; the results confirm that below-normal temperatures have been rare in the last 5 1/2 years from the Bering Sea to the Gulf of Alaska.  The warm signal also extends across the Arctic Ocean to the Atlantic waters north of Iceland.


The reanalysis temperatures at 925mb (about 700m above sea-level) show a similar picture, although here the most persistent warmth is evident in the Bering Sea sector.  It is very striking to see such a strong signal at this high latitude (where month-to-month and year-to-year variability are high) and in the free atmosphere aloft (i.e. not immediately tied to ocean conditions).


A broader view extending south to 20°N shows that widespread persistent warmth has also occurred over the eastern and northeastern North Pacific; the pattern looks very reminiscent of the positive PDO phase, which is no surprise as the PDO has been positive almost constantly since early 2014, with a strongly positive anomaly at times.


A parallel analysis of sea surface temperatures since June 2013 (see below) shows that unusual warmth has prevailed nearly all the time from the western tropical Pacific to the eastern subtropical North Pacific as well as in the western North Atlantic.  Note two regions of relatively cooler conditions, however: in the North Atlantic south of Greenland, and also in the eastern equatorial Pacific, where ENSO is traditionally expressed (i.e. El Niño and La Niña).  The absence of persistent warmth in the ENSO region implies that we can't immediately pin the Alaska and Arctic warmth on recurring or persistent El Niño conditions in recent years.


How about the upper-level circulation pattern?  At middle levels of the atmosphere, above-normal pressure has been strongly favored from western North America to the Bering Sea and far eastern Siberia, as illustrated by the frequency of above-normal 500mb height (see below).  In other words, there has been a persistent ridge axis in this area, which is consistent with generally above-normal temperatures.  (This feature was termed the "ridiculously resilient ridge" by climate scientist Daniel Swain in December 2013.)


It seems that the prevailing ridge from Chukotka to western Canada has been the dominant circulation anomaly of the Arctic and sub-Arctic region in the past 5 1/2 years.  An expanded view from 20°N to the pole (see below) provides additional perspective; 500mb heights have been very frequently above normal in more southerly latitudes, but the Bering-Alaska ridge is the only sector with a comparable signal at high latitude.  (Note that there is a strong upward trend in 500mb heights worldwide owing to rising temperatures, but the trend is masked at high latitudes in this analysis because the variance is much greater near the pole than in the tropics.)


So what can we conclude about Alaska's extraordinary warmth of the past half-decade?  The analysis suggests that there are two primary drivers of the persistent warm anomaly: rapid Arctic-wide warming and the positive PDO phase.  Below are 5-year running means that illustrate the two phenomena: first, the area-average 925mb temperature from 65-90°N, and second, the PDO index.  The third chart below is reproduced from the earlier post, showing Alaska's 5-year average temperature in the red line.


As a simple exercise, we can run a multiple regression for Alaska temperatures with these two predictors: Arctic 925mb temperatures and the PDO index.  Both predictors are highly statistically significant, and after taking a 5-year average the regression fit looks like this:


Although rather simplistic, this model manages to capture some of the main features of Alaska's temperature variation, and in particular it does a rather good job with the recent run-up.  One might argue that it's inappropriate to model Alaska temperatures in terms of Arctic temperatures, but we should note that the two temperature data sets come from independent frameworks (925mb reanalysis versus NOAA climate division data); and there's no question that we ought to make the connection between Alaska's climate and the extraordinary Arctic-wide changes of recent decades.

Based on this analysis, it seems reasonable to conclude that Alaska's warmth of recent years is at least partly - and perhaps mostly - a consequence of the positive PDO phase superimposed on a very warm Arctic background environment.  The rapid rise in the 5-year mean temperature seems most closely related to the change in the PDO, but it is interesting to note that the PDO did not turn positive until January 2014, whereas Alaska's warmth emerged more than 6 months earlier.  So as usual there appears to be more to the story, and I'll aim to follow up with a few more comments at a later date.

As a final note, it's interesting to see the large-scale patterns associated with the analogous rise in Alaska temperatures that occurred in the late 1970s (as noted in the earlier post) - see below.  There are some similarities, including the obvious positive PDO pattern and the warm signal from the western equatorial Pacific to the eastern subtropical North Pacific (also in the Indian Ocean), but the amplitude of the high-latitude warm signal was very much less than in recent years - at least according to reanalysis data.


Friday, December 28, 2018

What's the Snowiest Month?

Rick T. here. The lackluster snow season thus far in Fairbanks (less than 24 inches through Dec 28) has got me to thinking about the distribution of snow. In Fairbanks the month with the highest average snowfall is November, but does that mean that November is typically the snowiest month?

In plotting the monthly average snowfall, we see that for the 1981-2010 reference period the average (mean) November snowfall is only very slightly higher than December and is not too much higher than October or January. A quick and easy measure of the statistical significance of these differences is to apply Welsh's t-test to the data. This test tells us what we might have guessed: there is no statistically significant difference in the mean snowfall across these four months. 

Of course, for something as variable as snowfall in Fairbanks, 30 years is not much of sample, and that is the primary reason the t-test fails to show significantly different means. One way to "get around" this limitation is to construct a series of artificial normals by using bootstrapping. For  this example, I've constructed 1000 30-year normals, using as input only the 1981-2010 observed monthly snowfall totals, assumed there is no trend and that there is no month-to-month correlation: for 1981-2010, none of consecutive months are significantly (95%) correlated. When we do this, we get the following random sample: November has the highest average snowfall 51% of time time, while December has the highest average snowfall almost 37% of the time.
Finally, climbing out of the statistical sandbox, how about we ask "what was the snowiest month" for the winter in full Fairbanks climate record?

Here we see that while November has been the snowiest month in any given winter more often than any other month, it's the snowiest month less than 30 percent of the time: realistically, any month October through February might be the snowiest month in a particular winter, and there is more than a 10 percent change that either March or April will be the snow month (September has never been the snowiest month, but 2015 came close).


Tuesday, December 25, 2018

GOES-17 Satellite Images for Alaska

Hi,

Rick T. here with a quick Christmas note.

Levi Cowan, who is from Anchorage, runs the well known and well respected website Tropical Tidbits. While Levi's primary interest (and the origianal impetus for  TT) was tropical cyclones, his website is one of the most widely used for accessing numercial weather and climate model data because of the inovative ways he displays the model information. Increasingly he is adding satellite data to the website, and on Christmas Eve 2018 he added an Alaska-centric sector with five different channels from the soon-to-be operational GOES-17. Below is Christmas Day 6-hour loop at 15-minute intervals of the standard infrared channel: there is an immense about of info here.

In addition to high resolution images and loops of the three standard channels (infrared, visble and water vapor), also available are the "natural color" channel (this will be very popular once the sun returns) and a combination visbile/near infrared channel  that provides useful imagery day and night. If you're interested in real-time satellite information for Alaska and vicinity you'll want to bookmark these websites. Happy Holidays.

Thursday, December 20, 2018

Winter's Weak Sunshine

Here's a lovely webcam view from UAF's West Ridge at about solar noon today, after clouds cleared out following a lengthy period of light snow in the last couple of days.  At this point on the calendar, the sun rises a mere 2° above the horizon at noon in Fairbanks.


The temperature at UAF was about 0°F when the picture was taken, but not far away at the valley-level international airport the temperature has been dropping steadily today as clouds diminish and solar insolation remains effectively zero even at noon.  The chart below shows that nearly constant temperatures prevailed for more than a day and a half while cloud and snow persisted, but the end of the snow presaged a sharp cooling trend.  It's classic interior Alaska weather in the depths of winter.


Tuesday, December 18, 2018

Warmth Since June 2013

Long-time readers will be familiar with the steady drumbeat of unusual warmth that has affected Alaska in recent years; it has been quite relentless for more than five years now.  Of course there has been plenty of variability from day to day and month to month, but cold spells have been mostly brief and muted in comparison to the lengthy and often striking warm periods.

So for example, relatively cold weather has emerged across western and northern Alaska in the past few days, but so far it's a trivially small cold anomaly compared to the persistent and pronounced warmth since mid-September.  Four consecutive days below 0°F in Fairbanks may seem chilly, but this is normal: since 2001, there have been at least four such days in a row (and often many more) in November or December every year except 2014 and 2017.


When we look back at the evolution of the now multi-year warm spell, it is quite striking to note how suddenly it emerged in early summer of 2013.  Again, long-time readers may recall the extraordinary events of April and May 2013: one of the coldest Aprils on record, and then May transitioned from exceptional cold (with extremely late break-up and green-up) to remarkable warmth by the end of the month.  The following month, June 2013, produced the warmest week of record in Fairbanks.  The blog posts from back then make for an entertaining read, e.g.

http://ak-wx.blogspot.com/2013/06/oh-what-may-it-was.html

Here's a chart of monthly mean temperature anomaly in Fairbanks since 2000, using the 1981-2010 normal as a baseline.  The absence of cold since June 2013 - with the exception of March 2017 - is very striking.


It's worth looking at standardized anomalies too, because the typical variance of temperature is so much smaller in summer than in winter.  The persistence of warmth since 2013 is perhaps a little less dramatic in standardized anomalies, implying that winter warm anomalies have contributed most in absolute terms, as expected.  Relative to the normal range of climate there have been a few notably cool summer months (e.g. June 2014 and June 2018), but nothing exceptional.


The chart below shows the monthly anomaly values for Alaska's statewide area-average mean temperature (from NCEI climate division data); the very sudden 2013 reversal from cold to warm is not quite as striking for the state-average temperature, but the absence of below-normal temperatures in the subsequent years certainly is remarkable.


In response to the persistent warm pattern, the 5-year running mean of monthly temperature anomalies has risen steadily since the 2013 change and has moved well above the previous record in the modern climate history - see below - and it's a very similar story for Fairbanks and for the state of Alaska as a whole.


An interesting aspect of this chart is that it reveals a very similar sustained rise in temperature in the late 1970s.  In that case the persistent warming really got under way with the exceptionally warm winter of 1976-77, coinciding with the "great Pacific climate shift" of the same time; this sudden change of climate has been studied extensively.

From the perspective of Alaska temperatures, the 2013 shift looks very analogous to that of 1976, and in fact there is a remarkable correspondence in the rate of rise of the 5-year running mean temperature anomaly.  Here's the linear trend in the 5-year running mean state-average temperature, for periods of equal length:

May 2013 - November 2018: +0.77°F/year
May 1976 - November 1981: +0.77°F/year

For Fairbanks, the trends for the two analogous periods are as follows:

May 2013 - November 2018: +0.67°F/year
May 1976 - November 1981: +0.59°F/year

Having noted the similarity of the trend, however, it's also worth noting that the prior warm spell beginning in 1976 did not have quite the same degree of exceptional month-to-month persistence that we've seen in recent years.  The chart below shows the monthly statewide anomalies relative to a contemporary normal.


Of course it will be very interesting to see if the analog continues to play out in terms of the duration of the period of rapid warming.  In the previous iteration, the 5-year mean rose rapidly for a little under 6 years; so perhaps Alaska will start to see a return to cooler conditions in the next year or so.  I wouldn't bank on it, however.

I'll follow up soon with another post on the large-scale changes that accompanied the 2013 shift; it would be nice to identify at least one or two candidate explanations for why such a dramatic change has occurred (beyond the obvious background long-term warming trend).

Friday, December 7, 2018

North Slope USGS Data

A couple of months ago, word emerged of a new USGS data set that documents 18 years of climate measurements on the North Slope.  Starting in August 1998, automated stations began to be installed in locations within the National Petroleum Reserve-Alaska and the Arctic National Wildlife Refuge, and 16 sites are currently operating.  Here's a map of the locations (click to enlarge):


And here's the link to the data set:

https://pubs.er.usgs.gov/publication/ds1092

In Rick's words, this is likely a gold mine of North Slope climate information.  I started by taking a look at the ground temperature data - so this post is something of a follow-up to my brief comments on Fairbanks sub-surface data back in September:

https://ak-wx.blogspot.com/2018/09/permafrost-data-first-look.html

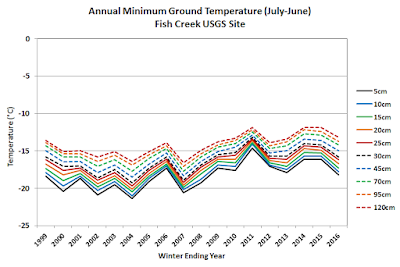
Five of the USGS sites have complete ground temperature data on at least 90% of days over the 18 years in the data set (August 1998 through July 2016), and the most complete data series is from the Fish Creek site, which is just a few miles from the coast between Teshekpuk Lake and Nuiqsut.  Here's a chart of mean temperature by depth for six 3-year periods spanning the 18-year period of record (it's easier to digest 6 lines than 18).


No surprises in these results - there was a substantial amount of warming over the period of record. There's also a warming trend in the seasonal minimum temperatures at each depth:


The annual maximum temperature chart is a bit more intriguing - see below.  At the lower levels there is a warming trend, but closer to the surface the summer's peak temperature has been lower in recent years; the cooling trend at 5cm depth is rather striking.


Looking only at data from the top level, the entire history of daily maximum temperature shows an interesting contraction of the annual range after about 2010; winter temperatures have not dropped as low in recent years, but peak summer temperatures have been reduced.  (This is not to say that the two effects have cancelled each other out - far from it, as the first chart above demonstrated.)


There are at least a few possible explanations for the apparent cooling trend in peak summer temperatures at the upper ground levels at Fish Creek.  Of course there could be systematic error or bias, perhaps from vertical displacement of the instruments over time due to freeze-thaw processes - although the Fish Creek site is not listed as one that experienced a lot of vertical "jacking".  Systematic trends may also have been introduced by changes to vegetation; perhaps increased growth has provided more efficient shading of the ground surface.

Another possibility is that summer cloud cover has increased over the period of record, leading to a loss of very sunny days at the warmest time of year.  A cursory look at the solar radiation data from the Fish Creek site supports this hypothesis, and I'll look into it for another post.

It's worth noting that the other sites with mostly complete data show mixed results in terms of the annual maximum temperature trends.  The data from Umiat show a very similar pattern to Fish Creek, but the others do not.  Note that there is a certain amount of missing data at all these sites and this undoubtedly affects the analysis of annual extremes (i.e. if you miss a few days, it can make a big difference).


For the sake of completeness, here are the mean temperature results from the sites with reasonably complete data.  The acceleration in warming at Tunalik and Inigok is rather striking, although the Inigok results are definitely affected by missing data for most of the winter of 2014-2015.  Accelerating warming at Tunalik is more plausible, as this site is the farthest west in the USGS array and sits close to the rapidly warming Chukchi Sea.


Wednesday, November 28, 2018

New ERA5 Reanalysis

One of the more exciting developments in the world of weather and climate science this year has been the release of new data sets by the European Union's Copernicus Climate Change Service.  The program is funding the free and open distribution of vast quantities of data through the Climate Data Store, so there is almost unlimited scope for new research as well as commercial development using the data.

The data set that I'm most excited about is the latest generation of reanalysis from the European Centre for Medium-Range Weather Forecasts (ECMWF), which is well-known for having the most accurate global weather forecast model in the short-medium-range time frame (out to two weeks in the future).  I've often used reanalysis data from NOAA on this blog, and indeed NOAA's global reanalysis from 1948-present is heavily used worldwide and is extremely valuable.  However, the NOAA reanalysis relies on a model that is very out of date now.  Happily, the new ECMWF reanalysis - using the ECMWF's top-notch modeling capability - is now coming online via the Copernicus program; the data are currently available back to 2000, but next year we'll see the product extended back to 1950.

Here's an article about ECMWF's new ERA5 reanalysis:

https://www.ecmwf.int/en/about/media-centre/science-blog/2017/era5-new-reanalysis-weather-and-climate-data

Back in 2015 I did a brief comparison of NOAA's reanalysis data with real observations from Fairbanks; here's one of the figures, showing the very poor correlation of reanalysis to actual temperature and precipitation in summer.


The chart below is a similar figure using ERA5 data for the nearest grid point to Fairbanks, which happens to be located just to the south across the Tanana River (the grid spacing is about 20km).  The performance is impressive.  Now admittedly the correlations ought to be very high for temperature, because the ECMWF model uses surface observations to refine its gridded estimates of evolving weather conditions hour by hour.  However, precipitation is predicted by the model over short time intervals, so the model does not "know" how much precipitation occurred in reality; and neither ground-truth data nor radar estimates are used to improve the estimates.  Given that the ERA5 precipitation data is purely a (short-range) forecast, I think it's very impressive that the monthly correlations are as high as ~0.8 in May through July, when hard-to-predict showers and thunderstorms produce most of the rain.


Here's a look at correlations of daily rather than monthly temperatures through the year.  Daily low temperatures are generally more difficult to get right than high temperatures, because the warmest conditions of the day tend to be more closely tied to the more homogeneous, well-predicted temperatures of the free atmosphere above.


Finally, the wind speed estimates from the model are not as impressive; apparently the low-level wind regimes near Fairbanks are a challenge even for the world's best global modeling system.


In due course I will be acquiring a larger volume of the ERA5 data and will have a chance to do a more extensive analysis; and it would be fun to set up an online map catalog of ERA5 data for the Alaska domain.  If anyone has an interest in helping out with such a project, let me know - perhaps there could be a collaboration.

Wednesday, November 21, 2018

Freezing Drizzle

Residents of Fairbanks experienced one of the more unpleasant kinds of wintry weather at times last night and this morning: freezing drizzle.  At least, that's what was reported by automated instruments for a period of 7 hours at the international airport and more briefly at Fort Wainwright and Eielson AFB.

Freezing drizzle occurs when cloud droplets grow large enough to produce drizzle at the same time that (a) the cloud and underlying air temperature are below freezing, and (b) the cloud top is no colder than roughly -10°C.  The cloud and drizzle droplets are therefore supercooled, but the cloud is not cold enough to contain much or any ice.  (See this old post for a more detailed discussion.)

Here are the atmospheric profile measurements from Fairbanks airport at 3pm yesterday (top) and 3am today (bottom).  The observations fit the conceptual model for freezing drizzle formation quite nicely, with a saturated layer in the lowest few thousand feet - where the red (temperature) and green (dewpoint) lines are superimposed - but cloud-free air above that.


Here are a couple of shots from the Ester Dome webcam that normally looks out over Fairbanks.  These were taken after the freezing drizzle ended, but they show the low cloud layer below with fair weather above.


Looking at hourly ASOS data since 2000, Fairbanks tends to report freezing drizzle on just one or two days a year, on average, although the distribution is very uneven: a few winters account for most of the events.  Looking at a handful of sites across Alaska, here's the percentage of all observations (throughout the year) at which drizzle is reported along with a temperature below freezing:

Utqiaġvik/Barrow   0.39%
Bettles   0.08%
Fairbanks   0.06%
Anchorage   0.05%
Northway   0.03%
McGrath   0.03%
Tanana   0.02%
Gulkana   0.02%

I'm slightly suspicious of the data, because in more than 18 years of data there are zero reports of freezing drizzle in Eagle, Delta Junction, or Kaltag - all of which I understand to have the same ASOS instrumentation as the sites above.  Perhaps there are in fact some instrument differences that contribute to the variation in the results.

Here's the seasonal distribution of freezing drizzle reports in Fairbanks; less than 20 years is insufficient to build up a good climatology, but there does seem to be a preference for these events in early winter rather than mid-late winter.


Up in Utqiaġvik, where freezing drizzle is much more common, the majority of events occur in early winter and late spring; it is very unusual in deep winter, when moisture levels and temperatures are usually both too low to produce the phenomenon.


Saturday, November 17, 2018

Alaska Observation Palooza


Hi, Rick T. here. In searching back through Deep Cold posts, it looks like we've never put up a review of a subject near and dear to my heart: an overview of point-based weather and climate observations in Alaska. So, I thought it might be worthwhile to lay out some of the details. Note: this piece is acronym heavy. I've included a decoder table at the end.

When it comes to weather observations: right now here in Alaska, we are living in the golden age of real time environmental observations: the good old days were definitely not always good. When I started with the NWS in Alaska in 1988, for most of the year there were less than four dozen reliable, real-time 24-hour/per weather observations in the entire state, and some of those (ones with the asterisk in the graphics below) only had temperature, wind and pressure for part, or all, of the day. Every single one of these were operated by either then NWS, FAA or DoD.

There were more part-time or irregular weather observations the 1980s. There were perhaps 20 contract aviation observations (paid for by NWS or FAA) that took 6 to 16 observations a day, e.g. Umiat, Slana and Ambler. By the late 1980s the DoD dew line stations were no longer regularly reporting 24 hours per day but sent observation on an occasional schedule. There were a tiny number of NWS operated remote stations (RAMOS) that reported temperature and winds and were still operating in places like Anaktuvuk Pass and Sitkanak (southern Kodiak Island). There were some, but not usually real-time observations from a small number of the Soil Conservation Service (now NRCS) SNOTel sites. In the summer there were even more, from Alaska Fire Services RAWS (which were deployed and then removed at the start and end of the fire season) and from relatively few river gauges which had temperature and tipping bucket sensors.

Fast forward to today: a quick count of observations in Alaska available on the MESO-WEST website for 3am Saturday morning revealed about 785 separate observations with at least one meteorlogical element, and to that you could add more than a dozen more home weather stations that are online only on Weather Underground. Here's a graphic I made up in 2017 that identifies the operators and types of observation in the eastern Interior and Copper River Basin.
This shows most of the classes of 24 hour per day weather observations that are currently deployed around Alaska, with the exception of some coastal specific observations. You'll see that most of the platforms belong to some Federal agency (e.g. NWS, FAA, BLM, NRCS) but there are some others, including state of Alaska DOT and private (the home weather stations). The stations marked as USARRAY are an interesting class. These are actually part of a temporary, high density seismic monitoring network on which weather sensors have been installed. Only a  fraction of the stations have weather stations included (the full map is here). These stations have provided never before seen real-time weather detail over the North Slope and Brooks Range, you can as see in this graphic (same 2017 project):


On the climate side of the house, it's a different story. The March 1988 edition of the NCDC publication Climatological Data had data from about 130 stations in Alaska reporting daily temperature extremes and precipitation data, and this represents the vast majority of climate observations that were made that month in Alaska. About 75 of these were NWS cooperative sites which made observations once a day and the rest NWS and FAA (including the contract observations) and DoD sites. In March 2018, there were just over 100 stations with data in that publication, and NWS cooperative sites was still number about 75. The losses are mostly from the drop off of the aviation contract and DoD sites: almost none of those became strictly cooperative stations.

The big difference beween 1988 and 2018 is that now there are multiple sources of readily available climate data that are not included in the Climatological Data publication. These include explicit daily climate data from unaugmented NWS ASOS (e.g. Kaltag and Seldovia) and the nearly two dozen NCEI flagship Climate Reference Network stations as well as derived climate data from the 100+ RAWS (mostly operated by the Alaska Fire Service and National Park Service) and four dozen NRCS SNOTel sites. Now one can question the climate value of some of these platforms, e.g. RAWS, which we know report temperatures that are too warm during high-sun, low-wind situations to due insufficient thermistor shielding, but clearly, Climatological Data is no longer the definitive source for Alaska climate data. Rather, it's perhaps the definitive source for NWS cooperative data, only some of which is reported in near real-time, and of course this does (eventually) make it into online climate sources, e.g. the NWS NOWData and scACIS.

But that's not the end of the story. Since 2010 the FAA has upgraded nearly all of the early 1990s era AWOS, the first generation automated operational weather observing systems that included visibility and ceiling height, with modern automated equipment which is functionally very similar to the NWS ASOS, as well as installing this modern equipment at at airports that previously lacked any weather observations. There are about 80 of these these FAA owned and operated systems that report temperatures and precipitation in the same way as ASOS, including sites with long histories of climate observations as well as sites that have never had climate observations before. While these systems don't handle frozen precipitation, the temperature data is reliable, but at the moment none of this is being used systematically in most climate analyzes. It's not true that it's been tossed out: the data is all archived at NCEI and other online locations, but we're not making much use of it. Here's a plot of these stations climate data we're not using:


As a sidenote, I do keep track of the daily data from several of these location that have historic climate data (Kaktovik, Unalakleet, Gambell, Ft. Yukon) and use it in my work. So while we have many, many more weather observations nowadays, climate data has not expanded, and in fact over much of northern and western Alaska we have less now than we did 30 years ago.

Acronyms:
  • ASOS  Automated Surface Observing System: the NWS standard, requires commercial power
  • AWOS Automated Weather Observing System: the first generation FAA station, did not report climate data, required commercial power 
  • NRCS: Natural Resources Conservation Service: Successor to Soil Conservation Service, part of the US Department of Agriculture. 
  • RAWS: Remote Automated Weather Station: the workhorse of fire weather. Run on solar or wind power, often installed at higher elevations 
  • SNOTel: Snow Telemetry: NRCS station widely in the West and Alaska primarily for to measuring snow pack but now includes in a variety of meteorological parameters. 
  • USARRAY: US Array: a 15-year program to place a dense network of permanent and portable seismographs across the continental United States. Installed in Alaska 2015-17, scheduled for removal starting in 2019.