Sunday, May 30, 2021

Wild Temperatures

The weather of the past week in mainland Alaska is a tale of a remarkable ridge of high pressure that intensified and migrated northward across the west coast and up into the Arctic.  At its onset the northward surge of warm air brought very warm conditions to southern and western Alaska on Tuesday, including 71°F in Anchorage, 78°F in Talkeetna, 75°F in Bethel (tied for 2nd earliest 75°F on record), and 80°F at Sleetmute on the Kuskokwim River.  The high-quality CRN site at Port Alsworth on Lake Clark reached 77°F, after a morning low temperature of 28°F; that's the largest daily temperature range outside of winter at that site since the sudden heat wave of late May 2013.

The heat extended farther north too: Nome reached 71°F on Tuesday, and as in Bethel, this was tied for second earliest on record for such warmth (72°F occurred in May 22, 2002).

Below are 500mb height charts from 3am on Monday, Tuesday, and Wednesday mornings: the ridge ballooned up into the Arctic by Wednesday, with a remarkable peak geopotential height of 5700m.  This is the highest on record for the month of May over the Pacific side of the Arctic Ocean (based on ERA5 data since 1950).


With a strong anticyclonic circulation taking shape around the ridge as it became cut off from the mid-latitude jet stream, the flow turned to the north over central and eastern Alaska - and the temperature started to drop.  Arctic air began to intrude, and on Friday an upper-level low pressure system dropped in from the northeast, forced down to the south and west by the flow around the ridge.  Here are Thursday, Friday, and Saturday mornings:


And so by Friday morning wintry conditions had returned to northeastern Alaska: Toolik Lake dropped to 17°F with fresh snow.  Freezes occurred widely in the eastern interior; and to cap it all off, snow fell yesterday in parts of the eastern interior and at low elevations in the Alaska Range.  Eagle reported an inch of snow - the latest on record for the town, according to Rick Thoman.  Here are low temperatures ending at 8am Saturday morning: click to enlarge.


The sequence of events is a bit reminiscent of what happened back in April, when a record-breaking cold air mass dropped south in response to a strong ridge to the west (but over the Aleutians in that case).  The ebb and flow of these circulation features has been quite striking for some months now, with notable cold outbreaks causing problems in the middle latitudes (Texas in February, spring freezes in Europe and the eastern US); but I haven't seen any evidence of an increase in volatility or extremes on a hemispheric scale.

Here's a simple animation of the 500mb heights at 12-hourly intervals from last Sunday afternoon through yesterday afternoon.  A fascinating sequence for meteorologists!


Monday, May 24, 2021

Late Snow in Bettles

I was too busy to post on this at the time, but last Wednesday a very late snowfall occurred at Bettles, on the south side of the Brooks Range.  Rain turned to snow in the early morning hours, and even though the temperature remained above freezing, 2.4" accumulated by late morning before melting later in the day.  This is actually the largest snow event on record for so late in the season, with data back to 1951 (and some data back to 1944).  The only other snowfalls of 1.5" or more after May 15 were May 19-20, 1996 (1.6") and May 22, 1956 (2.0").


Here's a visual depiction of all 1" or greater calendar-day snowfalls in May through September since 1951, for both Bettles and Fairbanks.  Click to enlarge:

A couple of comments are in order.  First, that August 9 snowfall in Bettles is real: 2.6" fell in the middle of the day on August 9, 1969, and 2" was still on the ground the next morning.  The next day 3" was reported far to the southeast in Northway, so obviously it was an extraordinary cold snap for the time of year.

But the most striking feature of the chart is the increase in mid-September snows at Bettles in recent decades.  The change is remarkable: in the 40 years from 1951-1990, only 2 years saw a 1" snowfall on or before September 20, but in the latest 30-year climate "normal" there are 9 such years.  Digging into the reasons for this would make for an interesting study.


Tuesday, May 18, 2021

Warm Season Precip Normals

I mentioned in the last post that July retains the top spot for monthly mean precipitation in Fairbanks, according to the new 1991-2020 climate normals, and that historically this was not true for most of Fairbanks' modern climate history; August used to be wetter than July.  A July rainfall peak also differs from most of the state, as August is considerably wetter than July in all but the eastern interior and the North Slope.

To look at the shifting climate normal in more detail, here's a chart showing the overlapping 30-year normals since 1931-1960 for the warm season months.  A spate of wet July's from 2001-2010 brought a significant increase to the July average in the 1981-2010 normal, but the other months were largely unchanged until more recent years.  However, the 1991-2020 normal is wetter in each of June through September (but interestingly there's a slight downward trend in May).


Here's a time series view of the June-September totals (blue columns) and the fraction that is attributable to July (gray columns).


The change in July is largely attributable to a handful of very wet months, but the consistency of the high seasonal totals since 2014 is quite remarkable.  Here are a few blog posts from last summer about this:

https://ak-wx.blogspot.com/2020/07/wet-summers.html

https://ak-wx.blogspot.com/2020/07/rainfall-trends.html

https://ak-wx.blogspot.com/2020/08/back-to-rain.html

Another interesting aspect of the Fairbanks warm season climate history is that the early decades were also relatively wet, but the excess was seen mostly in August back then; August used to be distinctly wetter than July.  But this change isn't just about a shift in rainfall timing from one month to another; it also reflects a major change in the character of summer rain events.

Consider the chart below, showing the total precipitation in categories of daily totals, i.e. how much of the long-term normal is attributable to light versus heavy amounts.  The first two decades in this analysis (1931-1950) saw a higher fraction of precipitation from relatively light daily amounts, but over time there's been an upward trend in the contribution of high daily amounts.


The change in the distribution of daily amounts is connected to the July-August shift, because July rainfall is typically much more convective (brief, heavier events), whereas August rains tend to be stratiform in nature (lighter, more extended rains).  In recent years Fairbanks has seen a decreased frequency of August rains, but very heavy rains in July - while still quite rare - have begun to occur frequently enough to make a significant difference in the long-term rainfall totals.

For more on this topic, see this post from a few years ago:

https://ak-wx.blogspot.com/2017/07/wetter-in-july.html


Saturday, May 8, 2021

New 30-Year Normals

Back in January I started to compare the new standard 30-year climate normal period, 1991-2020, to the previous 1981-2010 benchmark.  This week NOAA released the complete new climate normals, so it's worth returning to the topic, with a focus this time on precipitation.

Most parts of the state saw an increase in annual average precipitation, which is broadly to be expected at high latitudes during a warming trend.  According to NOAA's climate division data, the largest increases were found in the north and west, while the northeastern Gulf coast and south-central Alaska were the only regions with a slight drying trend.


Interestingly, Fairbanks saw a greater increase in precipitation than the regional climate division data would suggest, with a +7.4% annual change that was quite well distributed throughout the year - although August and September stand out as having the largest changes in absolute terms.  July remains the wettest month of the year in Fairbanks; this was true for the first time in the 1981-2010 normals, and prior to that August held the top spot.


Precipitation is quite uncertain in much of Alaska because of the lack of good long-term observing sites across the vast area, so model-derived data can be a helpful complement.  Surprisingly, the ERA5 reanalysis actually suggests that precipitation has decreased slightly in parts of Alaska's interior - see below.  Obviously a more detailed comparison with (the limited) ground-truth data would be worthwhile to see whether Fairbanks is indeed an outlier with its more notable moistening trend.


If we look at seasonal changes around the state, summer and autumn account for most of the change in the west and north, and of course this is the wetter half of the year.  See below for graphics comparing the NCEI and ERA5 data for each of the four standard seasons.  (I attempted to set these up in a side-by-side table for easy viewing, but the blog editor didn't like that plan.)


ERA5 suggests that Arctic Alaska has become wetter throughout the year, but NCEI emphasizes the autumn increase, which is clearly related to reduced sea ice, more open water, and much warmer and moister air.  Climate data from Utqiaġvik does support a more uniform increase in precipitation throughout the year:


The rather notable drying trend in winter across the west-central interior and south-central Alaska is related to the persistent ridge of high pressure that has often dominated the regional circulation over the northeastern Pacific since 2013.  Observations from McGrath do reflect a modest decrease in winter precipitation, although I'm far from confident about the state of winter precipitation measurements at that location.  However, Anchorage shows no sign of drying out in winter.


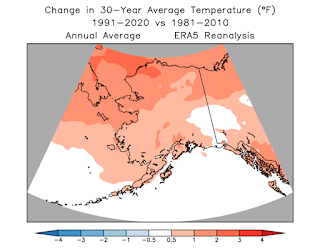
Since I have the maps handy, here's a similar comparison of NCEI and ERA5 temperature changes, for the annual average and the four seasons.  There's a major discrepancy in Southeast Alaska, where ERA5 shows far too much warming, presumably because of the model's inability to represent the complex terrain, but elsewhere the comparison is fairly good.