Saturday, February 26, 2022

Rapid Changes

Alaska's roller coaster of temperature swings this winter has produced another dizzying change in recent days, with widespread warmth enveloping much of the state since Monday.  The warm-up was very dramatic in western Alaska and brought a sudden end to persistent cold in the northwest.  In particular, Kotzebue had been stuck in a cold pattern since late January; minimum temperatures were in the -30s F for a week recently, but the past two days have seen above-freezing temperatures.


On a statewide basis, the handy index from UAF shows the episodic swings between colder and warmer, relative to normal, since autumn.  Overall, cold episodes have been more persistent and more unusual than the warm spells, although cold seems to be losing traction: the most recent cold period was less pronounced than earlier episodes (although not in northern Alaska).


Higher than normal variability of temperatures is a typical feature of La Niña winters - see this earlier post on this point:


Here's a sequence of model-estimated daily temperature anomalies over the past week or so.


Friday, February 18, 2022

Cyclone Trends

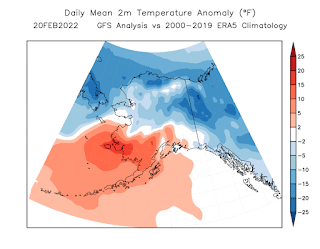
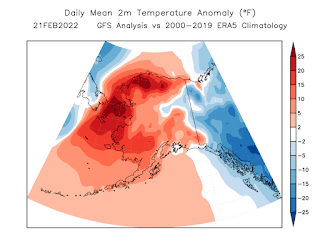
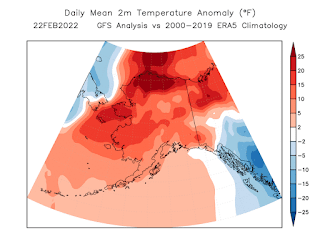
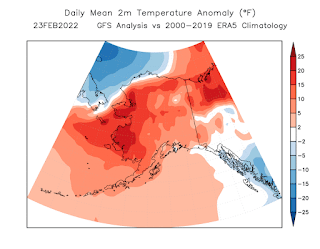
I'm in the middle of a busy season and unable to post much, but some readers may be interested in a bit of historical analysis that I did the other day in response to a Twitter query about North Pacific low pressure systems.  Are North Pacific winter cyclones becoming stronger?

There are probably dozens of ways to look at this question, but I used the ERA5 reanalysis to add up the number of hours below several MSLP thresholds at each location, by year, from 1950-2021.  I then calculated a linear trend for the number of hours, for example:


This shows that much of the basin has seen an increase in time spent below 960mb, which is a threshold that represents a moderately strong extratropical cyclone for this part of the world.  Gray areas on the map have less than 10 years in which the MSLP dropped below 960mb, so the sample size is much too small to draw a trend.

However, the trends since 1979 are mixed, showing that there hasn't been a robust basin-wide trend in the past 40 years.


For a basin-total view, here's a look at the annual area-time fraction below 960mb, 950mb, and 940mb.  To understand this metric, consider that if the entire area were below 960mb for 50% of the year, the annual area-time fraction would be 50%.  Alternatively, if 50% of the area were below 960mb for 50% of the year, the fraction would be 25%.  The actual values are mostly less than 0.1% for 960mb, and much smaller for lower thresholds.


Clearly ERA5 shows a significant increase in the frequency of strong storms in 1977, which coincides with the well-known change into the positive PDO phase in late 1976 (sometimes known as the great Pacific climate shift).  Since then, it appears there has not been a significant trend, but interestingly the last two years had a relatively high number of 940mb and 950mb storms.

Looking north to the Arctic, and using a higher MSLP threshold of 980mb, it's interesting to see that the same contrast emerges between the trends starting in 1950 versus 1979.  Click to enlarge:


This deserves more investigation: did Arctic cyclones also respond to the PDO shift?  A basin-wide Arctic analysis is hampered by the fact that storms are typically far stronger on the European side of the basin, so I'll have to think about the best way to deal with that.  But in the meantime, a subregion of the Arctic on the Alaska side shows generally higher frequencies since 1979 - see below.


Note that it's distinctly possible that the ERA5 reanalysis has a discontinuity in 1979, because the 1950-1978 data is a "back extension" that does not benefit from satellite data; perhaps that influences the intensity of cyclones in the model, although I suspect it's unlikely to explain the differences seen here.

Saturday, February 12, 2022

Snow Survey and January Climate Data

Yesterday I came across the February 1 snow survey report from NRCS, and it provides a useful and readable summary of Alaska's winter so far, at least from the perspective of temperature, precipitation, and snowpack.  Here's the February 1 NRCS snowpack map, showing far above normal snow water equivalent in the central interior, and above normal nearly everywhere that snow is measured (which is very far from everywhere).


Here's the general overview text for snowpack (click to enlarge); take a look at the report itself for separate comments on temperature and precipitation, and regional snowpack summaries.


While the "percent of normal" snowpack map is obviously very illuminating, I like to view the percentile map to see where conditions are near or exceeding records.  The following map (click to enlarge) shows SWE percentile with a minimum of 15 years of historical data.  There's a lot of blue, indicating record or near-record high snowpack, from the Koyukuk and middle Yukon drainage to the Chena and Upper Tanana areas and the Copper River basin.  Uncolored markers have less than 15 years of data, but no doubt many of those locations have very high snowpack too.  The only spot with notably low snow being reported is in the middle Chugach near Valdez.


Here are January climate anomaly maps from NCEI's climate division data and ERA5 data, showing the percentile rank compared to the prior 30 years.  According to the ERA5 model data, it was an unusually windy month in much of the state.


Rick Thoman's temperature map confirms that January temperatures were close to normal overall in much of the interior, but significantly lower than normal in the Arctic and western Alaska.  Utqiaġvik came in with marginally above-normal temperatures for the month, and interestingly this doesn't seem to have been captured by the gridded ERA5 data.


Wednesday, February 9, 2022

North Slope Cold

This week's story is the cold on the North Slope and Arctic coast, with temperatures below -50°F from the interior North Slope to the Sag River valley.  There was even a -51°F at Point Lay on the Chukchi Sea coast yesterday.

The cold at Deadhorse last night was remarkable: -55°F (rounded) at the high-quality CRN site just south of the airport, and -54°F at the ASOS.  Comparing this to the combined Deadhorse/Prudhoe Bay history, it's the coldest since February 1998 (-55°F), and we have to go back to January 1989 to find colder (-62°F, which is the all-time record).

The Deadhorse CRN joins the Tok 70SE, Selawik 28E, and Ruby 44ESE CRN sites in the -50°F club this winter, and these are also the only CRN sites that have recorded -55°F at any time in their brief operational history.


As for wind chill, it has been brutal, with breezes persisting even during the cold.  And not surprisingly, our old friend Howard Pass had another episode of ridiculous wind chill, reaching -93°F on Monday at noon (-43°F temperature with a 52 mph sustained wind) and then -92°F yesterday at noon (-40°F and 63 mph).


Saturday, February 5, 2022

Norton Sound Wind Storm

One month ago, I posted about a long-duration wind storm in south-central Alaska, and this week it was the turn of Norton Sound communities to endure sustained high winds - and in particular, Unalakleet.  Rick Thoman highlighted this on Twitter and in the following article:

https://www.knom.org/wp/blog/2022/02/04/uncommonly-consistent-strong-winds-rip-through-western-alaska/

Here's Rick's graphic showing hourly wind speeds in Unalakleet.  Sustained wind speeds were 50mph or higher most of the time from Wednesday morning through late Thursday afternoon, with gusts exceeding 70mph at the height of the event. 


Wind speed measurements have been made in Unalakleet, in one form or another, most of the time back to 1948.  Looking at that data, Wednesday and Thursday were the 2nd and 3rd most windy days on record in Unalakleet, with the only windier day (midnight-to-midnight) being January 21, 1952.  (This is taking the wind data at face value, although we know measurement techniques have changed a lot.)

This week is also the only time on record when the daily average wind speed was above 40mph for 3 consecutive days - and this is quite remarkable, given that Unalakleet is certainly a windy place in winter.

Tuesday through Thursday this week also had the highest 3-day average wind speed on record (based on midnight-to-midnight daily values).  Here are the winter peak values back to 1950-51.  The variability from year to year is generally quite small, so this event is a huge outlier: 5.5 standard deviations from the mean of the last 30 years!


The MSLP maps below (courtesy of Environment Canada) show the near-stationary weather pattern that gave rise to this extreme event.  Note the persistence of the tight pressure gradient over western Alaska, with the flow being squeezed between a stubborn anticyclone over Arctic Alaska and deep low pressure over the Aleutians.

3am AKST Tuesday:


3am AKST Wednesday:

3am AKST Thursday: