Objective Comments and Analysis - All Science, No Politics
Primary Author Richard James
2010-2013 Author Rick Thoman
Sunday, January 25, 2026
North Slope Accident
Tuesday, March 19, 2024
North Slope Chill
Friday, April 1, 2022
Sea Ice Update
First a quick comment again on northern Alaska, where winter is holding on. Temperatures have dropped into the -20s °F widely across the North Slope the last 3 nights, and not because it's been calm; strong winds have pushed wind chills down into the -40s and even -50s in some spots.
According to airport ASOS data, Point Lay on the west coast has seen nearly continuous blizzard conditions (blowing snow, presumably) since late Tuesday morning. Winds have been sustained at 30-40mph or greater the whole time, with a temperature between -10°F and -20°F. Not bad for April.
But of course we're nowhere near record cold for the time of year across the region. Daily record lows at Umiat are still in the -40s, and just last year it was -38°F on April 3. The Umiat thermometer notched -50°F on April 5, 1986, and that stands as the latest observed -50°F in the state of Alaska.
And now for an update on sea ice, a follow-up to this post from two months ago. Bering Sea ice has remained relatively abundant in terms of areal extent, at least compared to the recent history. Ice extent has mostly been well above last year and it has been far above the extreme lows of a few years ago.
The map below shows today's analysis from the NWS. On the plus side, full ice coverage is found as far south as Saint Paul Island, but on the flip side Norton Sound ice is already in poor shape, with a lot of open water visible on satellite (per Rick Thoman's Twitter comments).
Northern Bering Sea #seaice is in poor condition as seen in this false color NOAA-20 image courtesy @uafgina. The exposed water will warm with the increasing solar heating. Thicker ice Bering Strait & on the east side of St. Lawrence Island. #akwx @UAFGI @KNOMnews @nomenugget_ak pic.twitter.com/DysQlkpRXM
— Rick Thoman (@AlaskaWx) April 2, 2022
As for other seasonally ice-covered basins of the Northern Hemisphere, the major anomaly has been in the Sea of Okhotsk, where a January-March shortfall of nearly 200,000 km2 (over 20% of normal) has far exceeded the small Bering Sea surplus relative to normal. The Greenland Sea has also been running a deficit of about the same size as the Bering Sea surplus.
Friday, March 25, 2022
North Slope Cold
For the third year in a row, the North Slope of Alaska has seen a relatively cold winter, i.e colder than in many recent years. With a week left to go, the November-March period has been the coldest since 2012-2013 in both Utqiaġvik and Umiat. The deep winter period of December-February was colder two years ago, but that was mostly because of a very cold February 2020. Interestingly, February has been easily the coldest month of each of the past 3 winters on the North Slope.
This winter the cold was somewhat persistent from mid-November on, and each month from November through February was colder than the 1991-2020 normal (and the 1981-2010 normal) for the North Slope climate division. This is also true for the Northeast Interior climate division, but nowhere else in Alaska. However, with significant warmth in early March, it looks a bit unlikely that this month will be the fifth consecutive below-normal month.
In Umiat the number of days (72) reaching -30°F or lower was the highest since 2011-2012, but it only reached -50°F three times (compared to 11 times in Jan-Feb 2020). Utqiaġvik did not manage to reach -40° after succeeding in the last two winters.
I found myself curious about the correlation between winter temperatures on the North Slope and temperatures elsewhere in Alaska and farther afield, so here's a map. I've used detrended November-March average temperatures from ERA5, and the map shows the correlation with a grid cell near Umiat.
The interesting aspect of this to me is how the Brooks Range forms such an effective boundary in the temperature anomalies: the correlation between North Slope and interior Alaska winter temperatures is really modest - mostly less than +0.6 (i.e. less than about a third of the variance is joint). According to ERA5, Umiat winter temperatures are better correlated with temperatures over the central Bering Sea than in Fairbanks or even Fort Yukon.
(Note that I checked the ERA5 data against actual observations from Umiat since 2007, and the performance is surprisingly good: correlation of +0.99.)
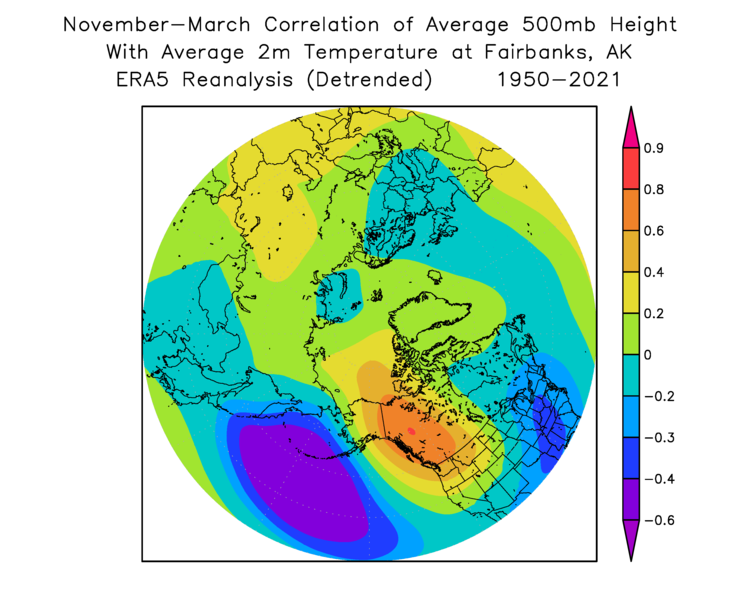
Here's the same correlation map but for Fairbanks winter temperatures: this shows a much more expansive area of high correlation, including across the Alaska Range (much higher elevation than the Brooks Range).
To visualize the flow patterns that have the greatest linear relation to winter temperatures in Umiat, the map below shows the correlation with 500mb height. A ridge anomaly right over Alaska is favorable for North Slope warmth in winter, but a trough tends to brings cold. This contrasts with the more expansive (PNA) correlation pattern for Fairbanks - second map below.
For completeness, below are the MSLP correlations. Interestingly, low pressure over the eastern Bering Sea is closely connected to winter warmth in Fairbanks, but it has the opposite correlation (albeit slight) with Umiat temperatures.
Wednesday, February 9, 2022
North Slope Cold
This week's story is the cold on the North Slope and Arctic coast, with temperatures below -50°F from the interior North Slope to the Sag River valley. There was even a -51°F at Point Lay on the Chukchi Sea coast yesterday.
The cold at Deadhorse last night was remarkable: -55°F (rounded) at the high-quality CRN site just south of the airport, and -54°F at the ASOS. Comparing this to the combined Deadhorse/Prudhoe Bay history, it's the coldest since February 1998 (-55°F), and we have to go back to January 1989 to find colder (-62°F, which is the all-time record).
The Deadhorse CRN joins the Tok 70SE, Selawik 28E, and Ruby 44ESE CRN sites in the -50°F club this winter, and these are also the only CRN sites that have recorded -55°F at any time in their brief operational history.
As for wind chill, it has been brutal, with breezes persisting even during the cold. And not surprisingly, our old friend Howard Pass had another episode of ridiculous wind chill, reaching -93°F on Monday at noon (-43°F temperature with a 52 mph sustained wind) and then -92°F yesterday at noon (-40°F and 63 mph).
Wind chills in northern Alaska are playing in the big leagues Sunday evening. That -76F at Howard Pass: -32F with sustained 45mph winds. #akwx @Climatologist49 @kenrhill pic.twitter.com/Sdlqeoctto
— Rick Thoman (@AlaskaWx) February 7, 2022
Tuesday, June 15, 2021
Summer Heat
The heat is on for the eastern half of the interior today, with widespread 80s, including 83°F so far in Fairbanks and 84°F in Eagle. Many RAWS site are hotter, but that's typical under strong summer sunshine. More notable is the heat across the eastern North Slope: 72°F at Barter Island, and 80°F at Deadhorse on a southwest wind before the sea breeze kicked in. Click to enlarge:
The 80°F at Deadhorse is the first time in nearly 3 years that the temperature has exceeded 73°F. The calendar years of 2019 and 2020 had maximum temperatures of 73°F and 71°F respectively, which is actually the coolest pair of summers (by this metric) since 1987 and 1988. But all four years from 2015-2018 saw at least one 80°F day in Deadhorse. Here's a visual representation of all 75+ and 80+ days since 1970 in the combined history from Deadhorse and (prior to 1999) Prudhoe Bay.
It's interesting to note the occurrence of warm days in August - remarkably late in the summer for the Arctic coast - between 1989 and 2007. Also, the trend towards earlier hot days seems notable: prior to 1990, the earliest 75°F was July 3, and today was the earliest 80°F on record.
In other (but related) news, Fairbanks airport has been reporting distant wildfire smoke this afternoon: presumably the result of the Haystack fire 20 miles north of town. This is the first smoke report at the airport since June 1st of last summer, and that was the only day last year that reported smoke.
Wednesday, February 10, 2021
Arctic High Pressure
Harsh cold is persisting at many interior locations and also across the Brooks Range and North Slope, with numerous -40°F to -50°F readings this morning, and some even colder. Notable low temperatures in the past couple of days include:
-49°F at Galena in the western interior
-56°F at the Birch Creek RAWS just above the Yukon Flats
-46°F at Anaktuvuk Pass, 2100' elevation in the Brooks Range
-58°F on the upper Sagavanirktok River
The latter is apparently the coldest observed in Alaska so far this winter; Chicken reached -57°F a couple of days ago.
Severe wind chill continues to afflict Arctic coastal sites, and the breeze even picked up at Umiat today: around 6am, a mean hourly wind speed of 11 mph combined with a temperature of -52°F. This turns out to be the highest wind speed on record at Umiat with a temperature below -50°F (with hourly data back to 2007).
Looking at the surface analysis from 3pm yesterday, we see the same Arctic high pressure system that I highlighted in my last two posts - except now the high has expanded over an enormous area from the Chukchi Sea to northwestern Canada and across to Greenland. It's really a sight to behold: click to enlarge.
The all-time record highest MSLP over the Arctic Ocean is 1069mb (per ERA5 data since 1950), so this is not far off. It's a rare anomaly, and it's responsible not just for the cold in Alaska, but for outbreaks of severe cold far to the south in the lower 48 and also in Europe.
Thursday, February 4, 2021
Frigid in the North
With high pressure over the Arctic Ocean continuing to funnel very cold air into northern Alaska, surface conditions have become downright frigid across the interior and eastern North Slope, with widespread -40s and some -50s today. Umiat reached -55°F this morning according to the RAWS instrument, and saw a high of only -47°F this afternoon.
But at least there's no significant wind in Umiat. From Deadhorse all the way across to the Canadian coast, wind chill values are -70°F or lower, with stiff offshore breezes creating seriously nasty conditions.
The lowest temperatures occurred in the sheltered valleys of the interior North Slope to the south and southwest of Umiat; satellite measurements suggest some spots may have dropped below -65°F. Here's a satellite-observed temperature map courtesy of Twitter user wrighthydromet (click to enlarge).
Our favorite wind chill site, Howard Pass, also had a very extreme episode of wind chill yesterday, with sustained winds over 50mph in conjunction with temperatures below -40°F. This is the first time in 7 years that the Howard Pass thermometer has dropped below -40°F, although missing data is an issue.
Back in December I looked at the strong inverse relationship between wind and temperature at Howard Pass. Remarkably, -40°F or lower has only ever occurred with a wind speed of 37mph or higher, and the median wind is 48mph at such low temperatures. The chart below zooms in on the low-temperature portion of the hourly distribution of temperature and wind.
It's interesting to observe that while yesterday's cold blast was a typical wind chill episode at Howard Pass, the temperature didn't recover much last night as the winds quickly died down to almost nothing. Consequently, today's temperatures were easily the coldest on record for low wind speeds; this morning it was a full 10°F colder than previously observed at Howard Pass with a wind speed below 5mph. This illustrates the intensity of the cold air mass over northern Alaska.
Here's a surface analysis chart for 3am yesterday; notice the very strong pressure gradient over northwestern Alaska, an obvious prerequisite for these extreme wind chill episodes.
Wednesday, May 27, 2020
North Slope Meltout
209 PM AKDT WED MAY 27 2020 ...BREAK-UP UNDER WAY ACROSS THE NORTH SLOPE... WARM TEMPERATURES IN THE BROOKS RANGE ARE CAUSING RAPID SNOW MELT THAT WILL CONTINUE THROUGH THIS WEEKEND. RIVERS DRAINING TO THE NORTH SUCH AS THE COLVILLE, KUPARUK AND SAGAVANIRKTOK RIVERS ALL HAVE ICE REMAINING NEAR THE COAST, AND COULD HAVE ICE JAM ISSUES THIS WEEK AND WEEKEND AS RISING WATER LEVELS MOVE DOWNSTREAM. RIVERS NEAR THE ARCTIC COAST SHOULD BE MONITORED CLOSELY FOR ICE JAMS AND POTENTIAL FLOODING THROUGH THIS WEEKEND.
Here's the latest NWS breakup map (click to enlarge).
The average date for breakup at the Colville River delta is June 3, based on reports since 1996, so this year will not be far from normal. The historical chart - see below - suggests a trend towards later breakup, but this is entirely because of two early years at the beginning of the series. The long-term trend in temperature during May is most decidedly up.
Here are a couple of satellite images that illustrate the extent of snow cover remaining; the first image below is from Monday afternoon, and the second image is from today (click to enlarge). Patchy cloud cover obscures the situation slightly, but there's no doubt the snow is disappearing.
[Update Friday pm: here's a great view from today, courtesy of and annotated by Rick Thoman.]
The Umiat webcams confirm that snow is gone on the middle Colville River (289' elevation), and even up at Toolik Lake (2460') there's a lot of bare ground now. Both of these sites have exceeded 60°F already; summer's here.
Saturday, February 8, 2020
North Slope Cold
The lowest wind chill value I've seen was at Nuiqsut, just south of the Colville River delta: yesterday evening it was -52°F with a 10 knot sustained wind, which is good for a -82°F wind chill index. This morning was even colder (as low as -55°F) but with a slightly lighter breeze. The only colder time in the 20-year history of data from Nuiqsut was in early 2012, when the air temperature reached -62°F (Jan 24) and the wind chill touched -86°F (Jan 31).
Deadhorse also saw its second worst wind chill episode last night, reaching -80°F (rounded) with an air temperature of -47°F. Only late January 2012 was colder (-51°F, wind chill -85°F).
Other sites with wind chills in the same vicinity were Kuparuk (-80°F) and the notorious (but well inland) cold spot of Umiat (air temperature -55°F, wind chill -79°F).
It's interesting to note that Deadhorse has seen an average wind chill of -47°F so far this year, and this is second only to 1989 (-48°F); mostly complete hourly data extends back to the early 1980s. Of course January 1989 was an extremely cold month in Alaska, and like this year, 1989 also saw a very strong polar vortex with lower than normal MSLP in much of the Arctic basin (strongly positive AO phase).
Compare the MSLP maps for January 1989 and 2020 below. While they're not identical, the north-south pressure gradient across Alaska is very similar. Of course below-normal MSLP in the high Arctic would tend to favor stronger than normal offshore (and therefore cold) winds along Alaska's north coast, and so it makes sense that wind chills were also severe in 1989.
Tuesday, October 22, 2019
Record Summer in Utqiaġvik
Teshekpuk Lake, to the southeast of Utqiaġvik and slightly inland, appears to be mostly but not entirely frozen over, judging from a satellite image from this afternoon (click to enlarge, and compare to last week's image):
Rick Thoman noted on Twitter the record-breaking warmth over the summer in Utqiaġvik - the attractive figure below is Rick's creation. The sum total of heat units for thawing was easily the highest on record and amounted to 3-4 times the totals from some colder years of about a half-century ago. The monthly TDD totals in both July and September were records, as were the monthly mean temperatures, and both by a large margin.
Here's a chart showing the 365-day running average temperature since 1930 in Utqiaġvik, plotted in degrees Celsius to highlight the diminishing difference from 0°C/32°F. One could be forgiven for thinking that the upward trend is accelerating, as the past few years have been really extraordinary.
The chart below provides a closer look at the last 25 years. It's curious to see how the temperature "broke out" in 2016-2017, as it suddenly exceeded a level (around -9°C) that previously served as an approximate upper limit, and ever since then it has remained above that level. Those who are familiar with technical analysis in the financial markets will recognize this kind of behavior, as financial instruments like stocks tend to show "resistance" and "support" levels in the price action. Perhaps some of the same tendencies can emerge from systems governed by physical laws rather than laws of human behavior.
Monday, September 9, 2019
More North Slope Warmth
Friday, December 7, 2018
North Slope USGS Data
And here's the link to the data set:
https://pubs.er.usgs.gov/publication/ds1092
In Rick's words, this is likely a gold mine of North Slope climate information. I started by taking a look at the ground temperature data - so this post is something of a follow-up to my brief comments on Fairbanks sub-surface data back in September:
https://ak-wx.blogspot.com/2018/09/permafrost-data-first-look.html
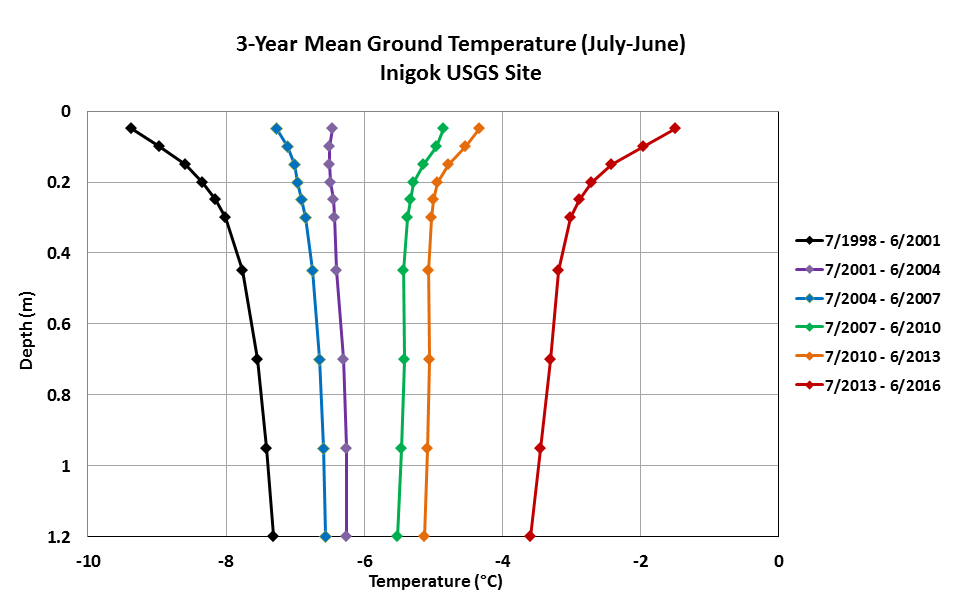
Five of the USGS sites have complete ground temperature data on at least 90% of days over the 18 years in the data set (August 1998 through July 2016), and the most complete data series is from the Fish Creek site, which is just a few miles from the coast between Teshekpuk Lake and Nuiqsut. Here's a chart of mean temperature by depth for six 3-year periods spanning the 18-year period of record (it's easier to digest 6 lines than 18).
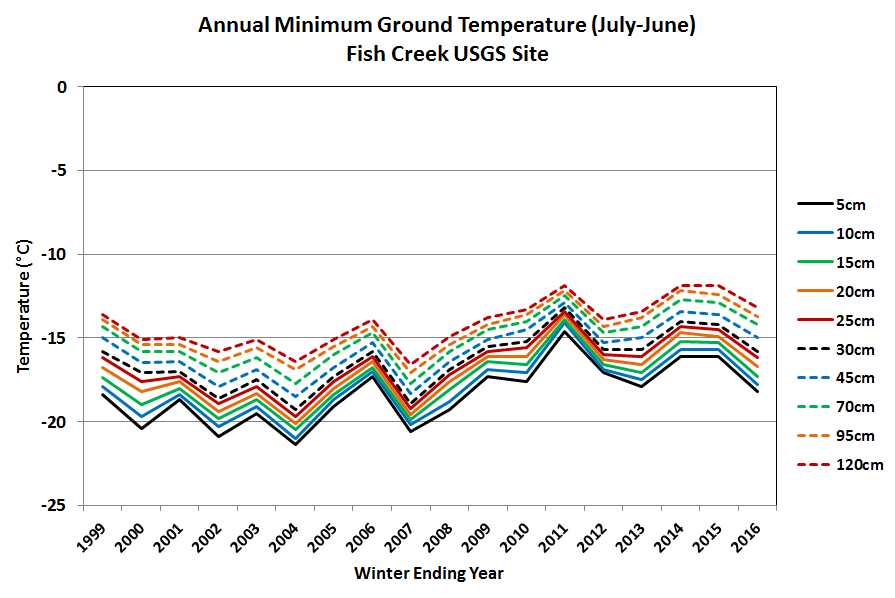
No surprises in these results - there was a substantial amount of warming over the period of record. There's also a warming trend in the seasonal minimum temperatures at each depth:
The annual maximum temperature chart is a bit more intriguing - see below. At the lower levels there is a warming trend, but closer to the surface the summer's peak temperature has been lower in recent years; the cooling trend at 5cm depth is rather striking.
Looking only at data from the top level, the entire history of daily maximum temperature shows an interesting contraction of the annual range after about 2010; winter temperatures have not dropped as low in recent years, but peak summer temperatures have been reduced. (This is not to say that the two effects have cancelled each other out - far from it, as the first chart above demonstrated.)
There are at least a few possible explanations for the apparent cooling trend in peak summer temperatures at the upper ground levels at Fish Creek. Of course there could be systematic error or bias, perhaps from vertical displacement of the instruments over time due to freeze-thaw processes - although the Fish Creek site is not listed as one that experienced a lot of vertical "jacking". Systematic trends may also have been introduced by changes to vegetation; perhaps increased growth has provided more efficient shading of the ground surface.
Another possibility is that summer cloud cover has increased over the period of record, leading to a loss of very sunny days at the warmest time of year. A cursory look at the solar radiation data from the Fish Creek site supports this hypothesis, and I'll look into it for another post.
It's worth noting that the other sites with mostly complete data show mixed results in terms of the annual maximum temperature trends. The data from Umiat show a very similar pattern to Fish Creek, but the others do not. Note that there is a certain amount of missing data at all these sites and this undoubtedly affects the analysis of annual extremes (i.e. if you miss a few days, it can make a big difference).
For the sake of completeness, here are the mean temperature results from the sites with reasonably complete data. The acceleration in warming at Tunalik and Inigok is rather striking, although the Inigok results are definitely affected by missing data for most of the winter of 2014-2015. Accelerating warming at Tunalik is more plausible, as this site is the farthest west in the USGS array and sits close to the rapidly warming Chukchi Sea.