Friday, September 8, 2023

Arctic Sea Ice Loss Revisited

An interesting study was published last week on the topic of Arctic sea ice loss, led by Igor Polyakov of UAF.  Here's a write-up from the Geophysical Institute:

https://www.gi.alaska.edu/news/new-research-points-mechanisms-atlantification-arctic-ocean

The thrust of the paper is that a change in the Arctic atmospheric circulation has contributed to the lack of sea ice loss since 2007, when the seasonal minimum reached its first dramatic record low.  Since then, Arctic sea ice has been relatively stable, and the new work suggests this is because the new wind patterns have been transporting more fresh water into the Pacific side of the basin.  Fresh water is less dense than salt water and resides immediately under the sea ice, and it serves to insulate the ice from warmer ocean water that would otherwise tend to melt the ice from below.

The following figure from the paper shows the rather surprising hiatus in sea ice loss (based on September ice extent), and the inset map shows the change in upper ocean "available potential energy", which signifies the quantity of fresh water at the surface.  The change to more fresh water and more stable conditions is largely found in the Beaufort and northern Chukchi Seas.


The paper presents a variety of oceanographic analyses to support the hypothesis about redistribution of fresh water into the Pacific sector, and the basic idea seems plausible to me.  However, to throw in my own two cents, I also think it's likely that a portion of the fresh water volume increase has arisen because of greater precipitation and greater river inflows in the past 15 years.

Let's illustrate these two additional factors.  First, it's well-known that the Arctic hydrological cycle is intensifying in response to rapid warming, and the 2021 NOAA Arctic Report Card highlighted the increase in Arctic river discharge, particularly for Eurasian rivers (providing the bulk of Arctic Ocean inflows):


Here's the link:

https://arctic.noaa.gov/report-card/report-card-2021/river-discharge/

The total discharge of all rivers to the Arctic Ocean is estimated to be approximately 5000 km3/year, which is equivalent to about 35 cm of fresh water depth over the entire Arctic Ocean area - but much of this water will reside close to the continents or be transported into the Pacific sector and the Beaufort Gyre, where salinity is low:


It seems plain that an increase in discharge will tend to fortify the fresh water layer in the Pacific/Canada sector of the ocean, especially with the more favorable wind circulation of recent years.  The percentage change in river flows evidently isn't large, but the recent effect may have been magnified by the change in transport patterns.  Here's a diagram of ocean and ice transport around the basin, from Polyakov et al:


The other factor may be increased precipitation.  Ground-truth precipitation measurements are very scarce and uncertain, of course, so here's the ERA5 reanalysis estimate of annual precipitation change between the two 15-year periods that are compared in Polyakov et al.


An increase of 5-15% is widespread across the Asian side of the Arctic Ocean, according to the model.  How much does this amount to?  The annual mean precipitation is very low, only about 250-300 mm (10-12 inches) across much of the area where the increase has occurred:


But in the northern Barents Sea, where annual precipitation is higher and the percentage increase has been large, the absolute increase amounts to 50-100 mm/year.


Interestingly, the total Arctic Ocean fresh water input appears to be roughly evenly split between the average ~35cm depth of river discharge and the average precipitation of about 20-50 cm.  (Some of the snow will evaporate, of course, but some of it melts in summer and feeds the surface fresh water layer.)  With both fresh water sources producing higher volume in recent years, it seems this has probably contributed to the build-up of fresh water and thereby to the longevity of Arctic sea ice.

The question remaining in my mind is how long can sea ice melt be postponed by these mechanisms in the face of rapid atmospheric (and presumably ocean subsurface) warming?  Polyakov et al suggest that the atmospheric circulation regime of the last 15 years is likely to reverse back to the opposite phase very soon, which would be unfavorable for sea ice and perhaps bring about another rapid decline.  It does seem unlikely that sea ice will hold on much longer, unless something very unexpected happens.  Courtesy of Zack Labe's website, Arctic temperatures are on a steep uptrend, including since 2007:


But time will tell, and I imagine that a few more surprises lie ahead.

Sunday, September 3, 2023

Record August Warmth

Just a quick note to re-emphasize how extraordinarily unusual the warmth of the last 6 weeks has been for the central and eastern interior, and particularly in terms of daily minimum temperatures.

Here's the leaderboard for average daily low temperatures in Fairbanks from July 16 through the end of August:

2023   55.2°F

2016   52.7°F

1990   52.5°F

2004   52.3°F

1974   52.3°F

2017   52.2°F

2021   52.0°F

This year stands out like a sore thumb.  The departure from normal represents a 3.3 standard deviation anomaly compared to the 1991-2020 distribution.  This is an extreme climate event, with a "return period" of many hundreds of years assuming a stable climate.

Accordingly, it's perhaps no surprise to see that there is *still* very little color in the foliage, based on Nenana and Cleary Summit webcam views from yesterday afternoon:


Here's a chart of Fairbanks airport daily minimum temperatures since June 1:


Looking at monthly statistics for August, Eagle had its warmest August on record (1905 is warmer in the books, but the minimum temperatures look much too high).  Northway was also the warmest on record, while Fairbanks was 3rd warmest overall, but warmest for daily low temperatures.  Gulkana also had its warmest August for daily low temperatures.

But change is in the air: snow was falling in the hills above Fairbanks yesterday morning.  Here's a view from Wickersham Dome, before the sky cleared out later in the day.


Thursday, August 31, 2023

Wet Pattern

Except for Southeast Alaska, much of the state is stuck in a wet and stormy pattern, and minor flooding is occurring on the Tanana River near Fairbanks.  The next round of stormy weather has prompted wind advisories and warnings to be issued for tomorrow in the Alaska Range as well as higher elevations to the north of Fairbanks.

The high water in the Tanana is coming mainly from excessive rains to the south - the Alaska Range - rather than the Yukon-Tanana uplands to the north, and it seems the Chena River isn't running particularly high.  However, the Snotel sites to the east of Fairbanks have also reported quite a lot of rain in recent weeks, for example 9 inches of rain at Upper Nome Creek in the last 3 weeks.


The Tanana gauge near Fairbanks shows the water level about a foot above flood stage, i.e. enough for nuisance flooding of low-lying areas.


Here's a before-and-after comparison of webcam views from Nenana: one week ago versus today.  Click to enlarge.


And here's a simple animation of the latest 10-day forecast from the ECMWF's deterministic model, showing a very active weather pattern with several troughs affecting Alaska in the next week.


Saturday, August 26, 2023

Copious Moisture

Flood watches are in effect from the Alaska Range eastward to the Canadian border, as a strong storm system drops moisture from a southwesterly flow originating in the tropics.  Here's a surface analysis from 4am today: note the storm tracking into southwestern Alaska from the central North Pacific (click to enlarge):


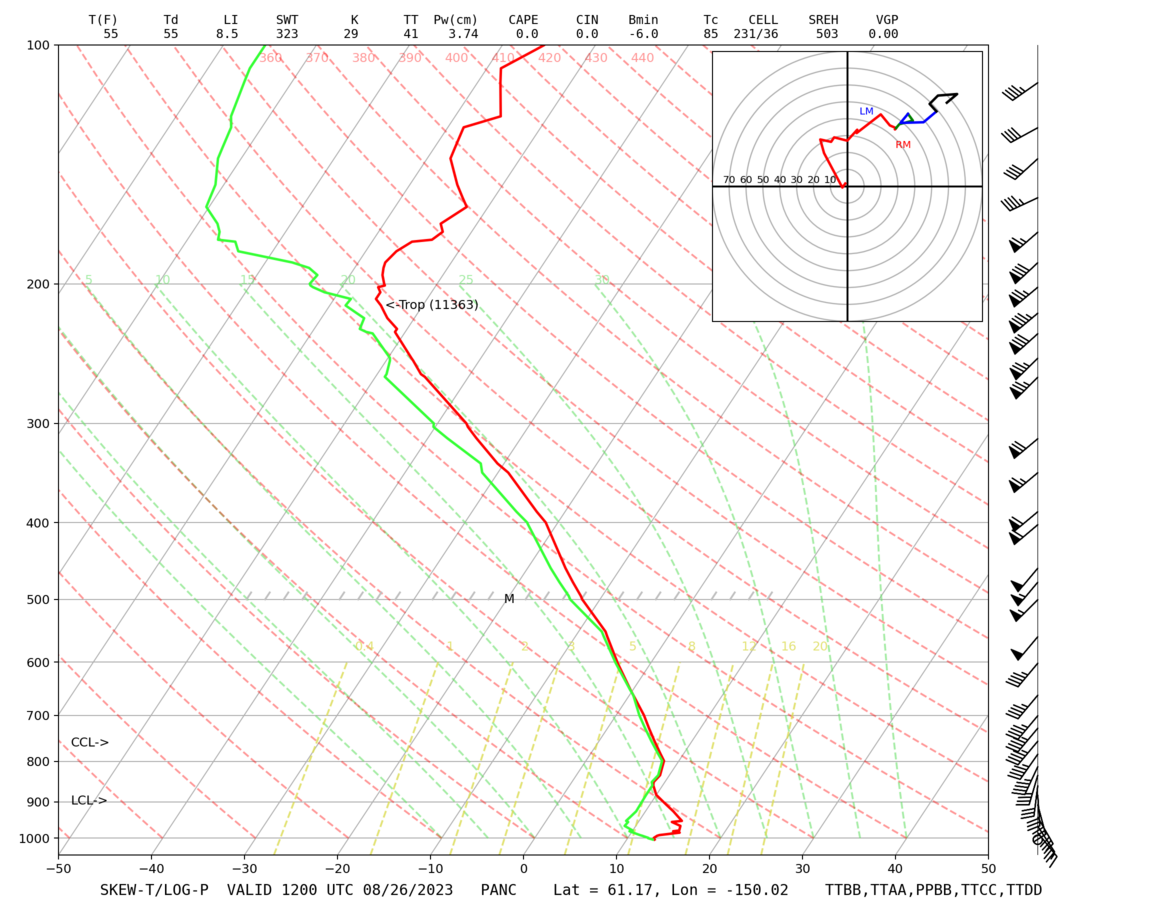
This morning's sounding from Anchorage measured nearly 1.5" of precipitable water (total vertical water content), which is extremely high by historical standards.  Here's the sounding: note the very deep saturation (dewpoint nearly equal to temperature) and strong southwest winds through most of the column.


Yesterday afternoon's sounding at Kodiak had even a bit more moisture, as is typical.


The highest precipitable water (PW) ever recorded by an Alaska sounding was 1.90" out at Shemya, on the other side of the Date Line, last August.  This is according to the IGRA database, which calculates PW from the surface up to the mid-atmosphere level of 500mb (the air above that level typically holds very little moisture because of its low temperature and pressure).  The western Aleutians are relatively far south, at less than 53°N latitude, and are often exposed to typhoon remnants with high moisture levels.

Excluding data from Shemya, Cold Bay holds the record for highest PW: 1.75" in July 2016.  I'm ignoring data from before 1960 because of low confidence in the measurements.

It's interesting to look at the history of annual maximum PW for each of Alaska's 14 currently-operational sounding sites.  There's a clear trend towards higher annual extremes at the northernmost sites, as we might expect with amplified Arctic warming.  (Note that the charts below use only June-September data so that I could require less than 10% of days missing in each year plotted.  Virtually all of the annual maxima occur in June-September.)


Sites farther south don't show a pronounced trend, but it's interesting to see that the mid-August 2019 rain event involved the all-time record PW at Anchorage and Bethel, and second-highest at Fairbanks:


Results for Cold Bay and Kodiak:


Yakutat and Annette Island both set new post-1960 PW records in late July last year, and the data from Annette shows very high PW in both 2021 and 2022.  This is very likely related to extreme North Pacific warmth in both summers, leading to higher moisture content in the air masses coming off the ocean.


Wednesday, August 23, 2023

Late Summer Nights

Reader Gary alerted me to the fact that so far there's very little autumn color in the trees around Fairbanks, and this is indeed unusual for the date.  Prime season for autumn foliage is typically from late August to early-mid September in the central interior.  Webcam photos from today confirm the report:

(Goldstream Rd at Old Steese Hwy)


(View from Cleary Summit on the Steese Hwy)


(Nenana)


Unusually warm weather is undoubtedly the main cause for the anomaly, and in particular it's the absence of cool nights, I think.  Check out how persistently warm the daily minimum temperatures have been since mid-July.


Remarkably, there has only been one day with a low temperature below 50°F since July 9, and that was a mere 47°F on Sunday morning.  Compare this to the 1991-2020 normal, which dropped below 50°F two weeks ago and is already down to 45°F.

No previous year (since 1930) had less than 3 nights below 50°F by this point in the season, so the absence of overnight chill is unprecedented in the modern climate record.  Not surprisingly, then, the average minimum temperature since mid-July is easily the highest on record:


Besides the dramatic long-term trend, it's also interesting to see the loss of sub-50°F values on this chart in the last 10 years; it seems it was only a matter of time before a new high mark was reached in the series.

In contrast to the persistently mild nights, daytime temperatures have dropped off quite sharply in Fairbanks as the warm and dry fire-weather pattern gave way to cloud, rain, and high humidity.

It's the abundant cloud cover that is now keeping temperatures elevated at night, because the air aloft isn't particularly warm any more.


For those who look forward to the change of season, a glance to the north reveals the future: today saw the first snow of the season at Toolik Lake.


Thursday, August 17, 2023

Summer Ends

To cap off the very unusual late summer spell of thundery weather in the interior, another round of strong thunderstorms passed through the Fairbanks area yesterday afternoon.  No severe thunderstorm warnings were issued this time, but the storms packed plenty of lightning, briefly heavy rain, and probably some hail in spots.  Here's a radar snapshot from 3:30pm with the storm core near Goldstream Road (click to enlarge, "FAI" marks the airport).


The ALDN notched another 2000 or so lightning strikes for the day, taking the seasonal total to 114,000 - not far below the seasonal normal.  What a turn-around in the past three weeks.


A much cooler air mass is now in place, with the temperature struggling to reach 60°F in Fairbanks today; it's an early-autumn feel.  Given the date on the calendar and the seasonably cool forecast for the next week, there's little chance of adding significantly to the lightning total after this point; we might say that yesterday's spectacle marked the end of summer.

Here are a couple of simple radar animations of yesterday's event: the second picks up where the first one ends.  An impressive system for any time of year, but quite remarkable for August 16th.


Tuesday, August 15, 2023

July Climate Data

August is rapidly advancing, but for the sake of posterity, here's a look back at July.  The high-latitude circulation pattern was dramatically different from earlier in the summer, and Alaska was primarily influenced by a strong ridge to the east and northeast rather than a persistent trough over the Bering Sea.


The big ridge over Arctic Canada produced some extraordinary warmth, including by far the warmest calendar month on record at Inuvik.  UtqiaÄ¡vik also had its warmest month on record, narrowly beating July 2019, and on the other side of the pole it was the warmest month ever measured at Barentsburg on Svalbard.  The maps below show monthly mean departures from normal in absolute terms (top) and in standard deviations (bottom).


The monthly ERA5 and NOAA/NCEI data sets both show the very unusual (locally record) warmth across eastern Alaska and the North Slope.  The ERA5 reanalysis indicates that it was significantly cooler than normal for the southwestern mainland and northwest Gulf coast, but this isn't supported by the NCEI data.  Checking in on data from Bethel and Anchorage, the month was in fact cool enough to fall into the lower third of the 30-year climate distribution at both locations, so ERA5 seems preferable.


The state as a whole eked out another month of above-normal precipitation overall, but not by much, and there were big contrasts between wet in the southwest/west/northwest versus dry in the central interior and Southeast Alaska.  The dry conditions in the interior set the stage for the late-season uptick in fire activity; Rick Thoman notes that Delta Junction had its driest June-July period on record, and evidently this trend is still persisting.


As for wind in July, the high-latitude blocking produced a much more stagnant pattern than in June, with relatively light winds across the North Slope and northern interior, but it was windier than normal in the southwest.  And sunshine was yet again lacking for the southwestern mainland and south-central Alaska: it's been a miserable time for sun-seekers down there this summer.


And in a comment for later elaboration: El Niño continues to develop in the tropical Pacific.  The SST pattern looks very El Niño-like already, but the atmospheric component of the phenomenon is having a difficult time getting its act together.  It will be interesting to see if this dichotomy continues.


Friday, August 11, 2023

Severe Thunderstorm Warnings

This summer the National Weather Service in Fairbanks has issued a lot of severe thunderstorm warnings, including three in the last couple of days, and another one just now.  Remarkably, yesterday evening's warning was for a storm near Eagle - a very long way from Fairbanks.

The total of 28 severe thunderstorm warnings this summer is far and away the most issued by the Fairbanks office, based on an archive back to 2004.


What's going on?  Has this summer actually produced far more severe thunderstorms across the central interior than any other summer in the last 20 years, or has there been a change of procedure?

It would be very interesting to work with the radar data to create an objective measure of the number of intense storms each summer, but it would be a lot of work - a good project for a Masters degree student, perhaps.  Lacking such an analysis, we can look at the lightning data, and it turns out that this summer is still on the low side of normal, although activity has been extremely high in the last two and a half weeks.  (But note that this pertains to the entire ALDN region west of 129°W, i.e. including a good portion of NW Canada.)


Have all the severe warnings been issued since late July?  Not at all: 18 of 28 were issued on or before July 17, when lightning activity was unusually low.  Here's a look at the date distribution of all severe thunderstorm warnings issued by Fairbanks; note that sometimes several are issued on the same day.


This summer has seen warnings issued periodically since mid June.

There has in fact been no change to the criteria for issuing these warnings, and so the most likely explanation is that the NWS meteorologists are much less hesitant to issue them this year.  It's probably not a good thing to see such a drastic change in practice; but there may be a few people receiving benefit from the warnings.

One other note, and this is a comment on the lightning chart, reproduced below.  It's quite interesting to see a bifurcation between active and inactive years from mid-July onward: the slopes of the cumulative lightning counts through the end of July are quite distinct.  And this highlights how unusual summer 2023 has been: it started out very inactive indeed for lightning, but now at the eleventh hour the lightning activity has ramped up at a rate worthy of a very active year, but a full month later on the calendar.

Notice too that none of the last 11 years has seen any really significant lightning activity after mid-August; so it would be extraordinary indeed if anything like the current pace continues for more than another few days.