Friday, September 13, 2024

Summer Climate Anomalies

Looking back at climate anomalies for June through August, the summer as a whole was wetter and slightly cooler than the 1991-2020 normal statewide - but with lots of variability in both time and space.  Here are my usual percentile rank maps based on ERA5 and NCEI data:


The contrast between east and west was substantial, especially for precipitation, and of course there was a dramatic difference between June and the rest of summer: June was very warm and dry, but it was followed by the wettest July on record statewide.  August continued the wet theme in the west and north, and was very cool in the southwest, but it was dry, sunny, and quite warm in Southeast Alaska:


All in all, it's notable that the North Slope climate division had its second wettest summer on record (1963 was wetter), and the West Coast and Central Interior divisions were third wettest; this is more remarkable after the dry start in June.

June-August temperatures were not especially notable anywhere owing to the big sub-seasonal contrasts.  The Bristol Bay climate division did have its coolest summer since 2012, but that's not saying a whole lot, because the past decade has been so warm:


It's quite interesting to inspect the time variability of temperatures during the season, courtesy of UAF's statewide temperature index.  Back in June, which ended up being much warmer than normal, the statewide temperature varied on a time scale of a few days, and without a great deal of volatility; but the generally cool pattern in July and August was punctuated by some enormous swings to the warm side: 

The big reversals into highly anomalous warmth around July 20-25 and August 4-8 prevented those months, or late summer as a whole, from being truly notable for a statewide chill.  The average temperature for July and August combined was again the coolest since 2012, but it wasn't a whole lot different from 2021 and 2022, and prior to 2013 it wouldn't have been unusual at all.


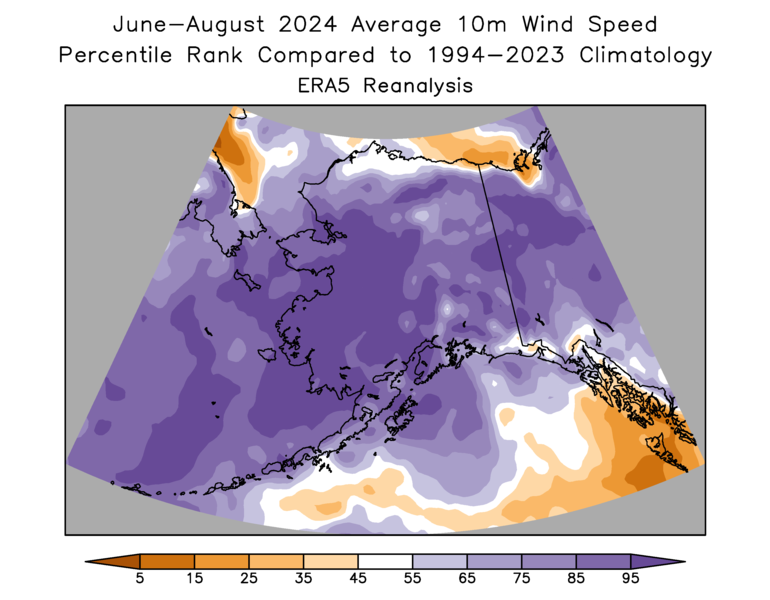
To round out the picture for the summer climate anomalies, here are the wind and sunshine maps:


The wind anomaly is really remarkable: according to the ERA5 reanalysis, the June-August average 10m wind speed was the highest since at least 1940 (the start of the dataset) over quite a wide area, including much of Norton Sound and inland to places like Kaltag and the lower Yukon valley down to the coast.  I'll see if I can illustrate this in more detail in a later post.

Saturday, September 7, 2024

Cool Bering/Chukchi Sea

I've mentioned the PDO (Pacific Decadal Oscillation) a few times in recent months, and late August brought a fresh dive into the strongly negative phase.  This reflects an expansion of below-normal sea surface temperature anomalies across the Bering Sea in response to the strong and persistent trough near the Date Line in late summer.


The very pronounced trough delivered very cool Arctic air from Chukotka across the northern Bering Sea to western Alaska, and very cloudy and windy conditions across the eastern Bering Sea really reinforced the cool ocean anomaly.  Here are some climate anomaly maps for the month of August:


As a result, the sea surface waters in the eastern Bering Sea and the Chukchi Sea became the most anomalously cool of any ocean area in the world by the end of August:


Here's a time series of SST anomalies since 2018 for the Bering/Chukchi area east of the Date Line and north of 56°N (i.e. Bristol Bay northward).


While the cool anomaly is now quite notable, it is nowhere near as pronounced as the extreme warmth in 2019, at least when assessing conditions relative to a prior multi-decadal normal.  Notice that most of the major anomalies occur in the summer and autumn, when sea ice is absent and the near-surface ocean layer can become much cooler or (especially) much warmer than normal.

A longer-term chart puts the last few years in context.  The current cool anomaly is among the most pronounced in the modern (satellite sensing) era, although we haven't quite reached the level of the 2011-2012 negative PDO extreme.


Monday, September 2, 2024

Follow-up on Sleet

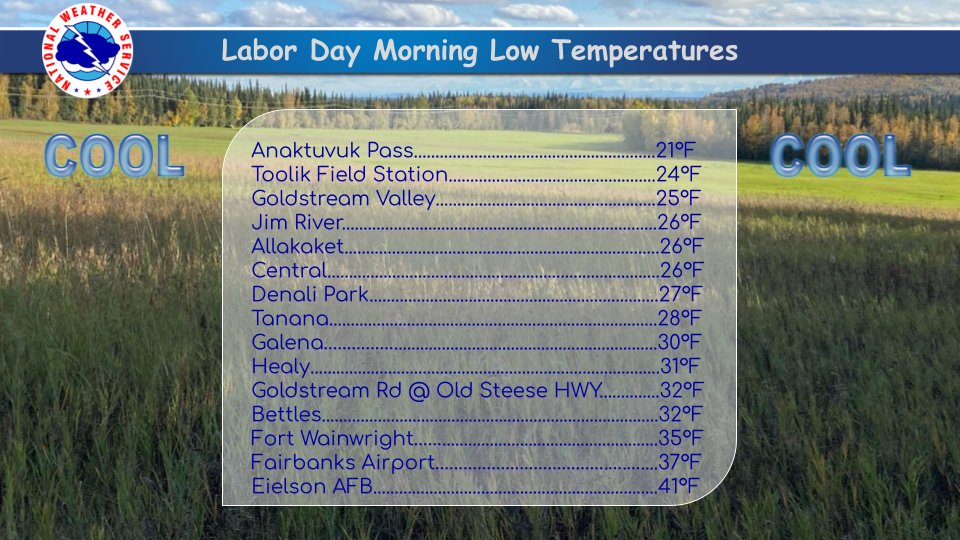
First things first: overnight freezes are becoming more widespread across the northern interior, as befits the season.  Here is this morning's list of some observed low temperatures, courtesy of the NWS in Fairbanks:


Webcam views show a delightful scene in many areas today:

Cleary Summit above Fairbanks


Central

Fort Yukon


Bettles


On another topic, Mike from Kaktovik posted a few weeks ago about sleet (ice pellets) falling in late July at his location on Barter Island.  I was curious to see what the ERA5 reanalysis has to say about the frequency and distribution of this kind of "wintry" precipitation.  According to the model, it is not particularly unusual for sleet to be the dominant precipitation type across the Arctic waters to the north of Alaska in climatological summer (June through August):


(It should be noted that the model diagnosis of a certain precipitation type does not imply that such precipitation actually occurred; the modeled precipitation rate might be extremely small at times.  A more comprehensive analysis would look at the precipitation rate as well.)

Not surprisingly, the estimated frequency of summertime sleet is drastically lower over land, but a close look at the image above reveals that the "offshore" region of higher frequency also extends over Barter Island (on the north side of the river delta region protruding north on the far northeastern coast).  ERA5 shows a 1991-2020 mean of about 50 hours per summer with sleet as the dominant precipitation type (subject to precipitation rate) at Kaktovik.

Here's a chart of the annual June-August frequency of the six ERA5 precipitation type categories at a grid cell location very close to Kaktovik:


The long-term increase in the dominance of rain reflects the multi-decadal warming trend.  Similar trends are seen if we take the area-average over a box encompassing the northern North Slope and nearby waters: all "wintry" precipitation types have decreased in frequency in recent years.


Interestingly, the same is not true over the Arctic Ocean farther to the north of Alaska: the ERA5 data suggests that snow and other icy precipitation types have become more common at the expense of rain in recent years:


Here are the annual values for a 74-78°N area-average well to the north of Alaska:


There seems to have been a notable change in 2007, which was a very big melt year for Arctic sea ice.  It's not clear to me why more open ocean would produce more, not less, wintry precipitation in summer; more investigation of the model temperature profiles would be required to explain what's going on here.

Monday, August 26, 2024

Another Landslide

The news of a major landslide yesterday in Ketchikan elicited groans of "not again" from many people around Alaska, I'm sure.  Landslides have caused loss of life and major damage on several occasions in recent years in Southeast Alaska, including last year's terrible event in Wrangell, a Juneau slide in 2022, and Haines in 2020.


It's clear that the latest event was tied to Sunday's heavy rain, although the rain amounts don't seem to have been at all unusual for rain-soaked Ketchikan.  The airport reported a little over 2.5 inches of rain, and this pales in comparison to many much greater rainstorms of the past, including more than 8" in two days in August 2017, and nearly 11" in two days in October 2015.  A more substantial 5" was measured near downtown yesterday, but again it doesn't seem particularly unusual.


What is unusual is that this was the first major rain after a very dry summer.  Prior to this storm, only about 6.5" of rain had fallen since early June, which is far below the normal of over 20" for that period.  The plot below shows that precipitation deficits were developing in late winter and spring as well (note that the latest day's rainfall is not included on the plot):


While concern has been expressed that ocean and atmosphere warming trends are driving an increase in excessively heavy rain events, it seems unlikely that this latest event can be explained so simply, and I haven't seen any quantification of how much the changing climate is contributing to increased risk.  It does seem possible that the last decade's outbreak of slides is just random chance in what has always been a landslide-prone region; but of course the more events we see in a short period (relative to normal), the less plausible "coincidence" becomes as an explanation.

Thursday, August 22, 2024

Ex-Typhoon Ampil

The third major storm in less than a week affected western Alaska yesterday, courtesy of the remnant circulation of Typhoon Ampil.  The low pressure center came in a bit farther north than the previous two storms, but high winds were widespread across the western coastline and hills.

Here's the MSLP analysis from 4pm AKDT yesterday, courtesy of Environment Canada:


The wind gusted to 55 mph in Nome in the early evening, and the peak sustained wind of 41 mph ties the Nome record for August, set back in 1949.  To find a stronger storm in early autumn, we have to look to the first week of September, when 44 mph sustained winds were measured in 1964.  (But instrumentation is different nowadays, so it's not really a fair comparison.  In recent years the most comparable event was August 24, 2012, with 37 mph.)

Here are some of the peak wind gusts around the region yesterday (in mph):


Although this is the 3rd storm in quick succession, it's actually the 4th storm to hit the west coast in the past two weeks (I missed the first one in my previous post).  Here's the MSLP analysis from the afternoon of August 10: this one came in much farther south.


The 14-day precipitation is 2-4 times normal across much of the west and northwest, and the anomaly pattern is extremely similar to the July outcome - except for Southeast, where it's been much drier lately.


Tuesday, August 20, 2024

Heat and Floods

There's an autumn chill in the air for much of Alaska this morning, but summer had a record-breaking last gasp in the eastern interior at the weekend.  Chinook flow from the south produced extraordinary downslope warming for southeastern locations, including 89°F at both Northway and Eagle on Sunday (the 90°F in the map below is a rounding error):


It's hard to overstate how anomalous this kind of heat is at this point on the calendar.  Northway, at 1700 feet above sea level, has only ever reached 89°F or higher in June, with data back to 1943.  The record highs for both July and August are 88°F, and of course the August record was set early in the month.  The previous highest temperature in the second half of August was only 84°F.

As for Eagle, with data (some gaps) back to 1902, the latest in the year for 89°F was August 15, 1982.   It also reached 90°F on August 12, 2013.

This is the second time this month with record-breaking heat for these communities: just two weeks ago, Northway saw its latest measurement of 87°F, on the 6th of the month.  Eagle was 90°F then too.

Here's the 500mb flow (as of 4pm AKDT on Sunday) that produced the downslope warming: notice the strong southwesterly winds between the major North Pacific ridge and the strong trough near the Bering Strait.


The Bering Sea trough and associated storminess has been causing havoc for the Kuskokwim Delta coast, with major flooding reported:


Two strong and very similar storms moved up the Bering Sea into the Seward Peninsula in the past several days: here are MSLP analyses from Friday morning (top) and Sunday afternoon (bottom):


Next up is the remnant circulation of Typhoon Ampil, which affected northern Japan last week.  The now-extratropical storm moved through the western Aleutians yesterday, and will near the Bering Strait late tomorrow.  Wind and flood warnings are in place for most of Alaska's west coast.

Saturday, August 17, 2024

Persistence

Continuing with July's theme of wet weather, western and southern parts of Alaska (except Southeast) have remained much wetter than normal so far this month.  Here's a "percent of normal" analysis based on NWS precipitation estimates for the latest available 14-day period.  Flood watches and warnings are out for several regions in the west. 


The wet pattern illustrates the idea that weather patterns often tend to persist for weeks or even months, but as we saw earlier in the summer, a dramatic reversal can occur too:


Thinking about this, I started wondering if weather patterns have become more or less "persistent" over the decades in Alaska.  A simple measure of persistence can be constructed by counting the frequency with which the precipitation (or temperature, wind etc) departure from normal reverses sign from month to month.

For example, if the pattern flips from warm to cold and back again every month of the year, then this persistence index is zero: the monthly anomalies have opposite signs in consecutive months.  But if all 12 months are warmer than normal, then the index is 100%: no sign reversals occurred between consecutive months.

Using statewide data from NOAA/NCEI, and using a trailing 30-year mean as "normal", the result looks like this:


Higher numbers correspond to more month-to-month persistence.  The first thing that strikes me here is how non-persistent statewide temperatures are; I would have expected higher persistence for temperature, given the large influence of nearby (and very persistent) ocean temperature anomalies on Alaska climate.  But having said that, the atmospheric circulation pattern governs a very large fraction of the temperature variability from month to month, so perhaps it shouldn't be surprising.

It's also interesting to see that persistence was relatively low for both temperature and precipitation in around 2005-2015 (the chart uses a 10-year running average), but temperature persistence has increased substantially in recent years.

The recent prevalence of month-to-month persistence is partly related to the sharp uptrend in statewide temperatures: if it's "warm all the time", then the persistence index will be high.  However, it's worth noting that the sharp increase in temperatures in the 1980s did not produce an equally dramatic rise in temperature persistence.  Here's a chart of actual decadal temperatures and precipitation; both have increased over the last 75 years.


To counter the effects of trend on the persistence index, it seems worthwhile to detrend the data.  After doing this with a simple linear trend (calculated for each month of the year separately), the persistence index looks like this:


We still see that temperature anomaly persistence has increased a lot in recent years, but the detrended perspective suggests that the 1970s and early 1980s were similarly persistent.

The precipitation result is quite interesting, with a slow and steady rise of persistence into the 1990s, a sharp change to more "flip-flopping" patterns after 2005, and then a recovery to a more normal situation recently.

How about summer and winter separately?  The chart below shows results for June through August (with the June values compared to May, so that June can be included).  Here we see a big spike in temperature persistence in the 1990s, but this is likely because summers started becoming much warmer then.  Historically cool summers became a rare breed starting in about 1987.


As for winter, the recent uptick in temperature persistence (see below) must be related to the rapid warming trend, although again it's curious that the warming in the 1980s didn't involve a similar increase in persistence - evidently there were still plenty of colder winter months interspersed with extremely warm months in that period.


Finally, the decrease in winter precipitation persistence this century looks like a "real" change compared to the more persistent regime of the 80s and 90s.  In the last 20 years or so, a wet winter month has been more likely than not to be followed by a dry month, and vice versa, i.e. the statewide monthly precipitation is anti-persistent in winter.  I find this interesting and not a little surprising.