
And here's the link to the data set:
https://pubs.er.usgs.gov/publication/ds1092
In Rick's words, this is likely a gold mine of North Slope climate information. I started by taking a look at the ground temperature data - so this post is something of a follow-up to my brief comments on Fairbanks sub-surface data back in September:
https://ak-wx.blogspot.com/2018/09/permafrost-data-first-look.html
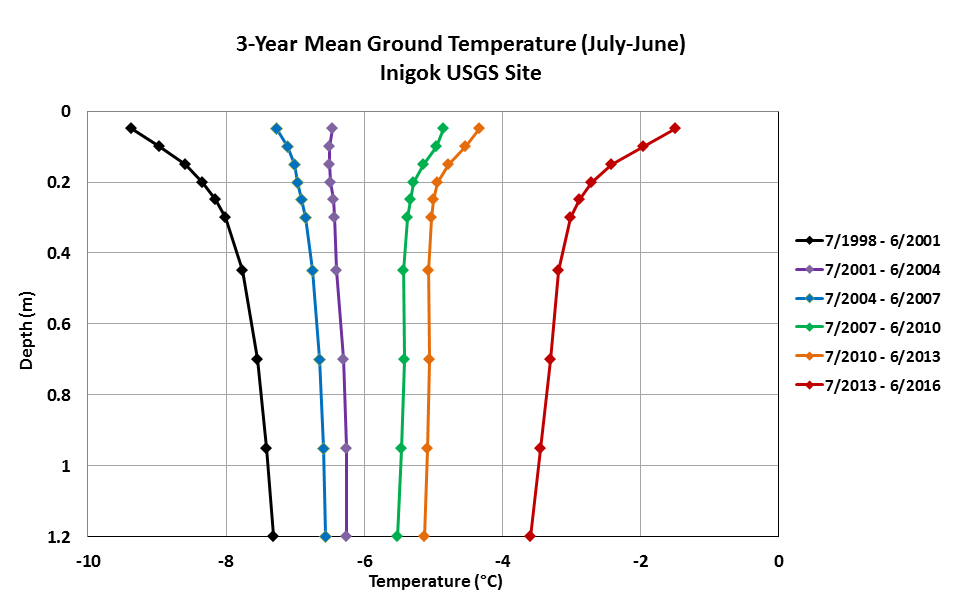
Five of the USGS sites have complete ground temperature data on at least 90% of days over the 18 years in the data set (August 1998 through July 2016), and the most complete data series is from the Fish Creek site, which is just a few miles from the coast between Teshekpuk Lake and Nuiqsut. Here's a chart of mean temperature by depth for six 3-year periods spanning the 18-year period of record (it's easier to digest 6 lines than 18).

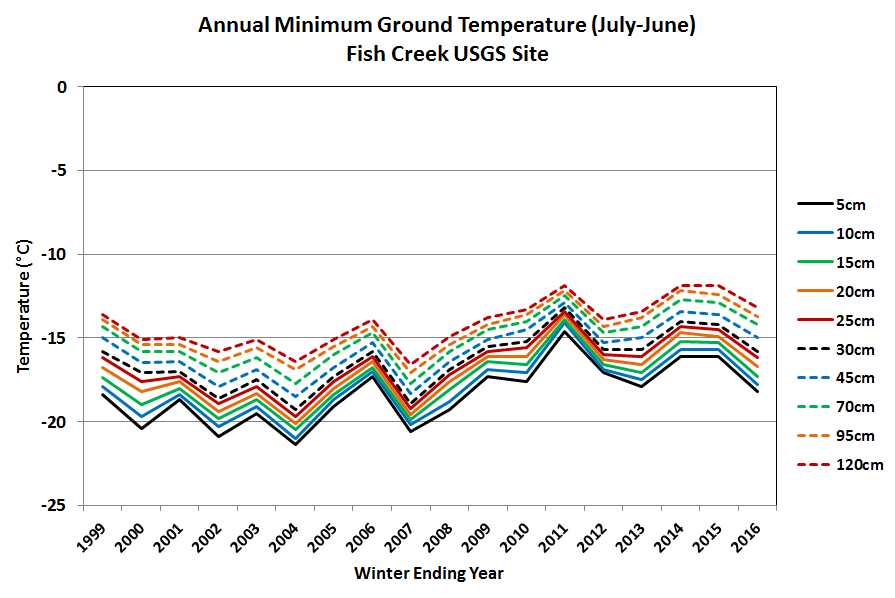
No surprises in these results - there was a substantial amount of warming over the period of record. There's also a warming trend in the seasonal minimum temperatures at each depth:
The annual maximum temperature chart is a bit more intriguing - see below. At the lower levels there is a warming trend, but closer to the surface the summer's peak temperature has been lower in recent years; the cooling trend at 5cm depth is rather striking.

Looking only at data from the top level, the entire history of daily maximum temperature shows an interesting contraction of the annual range after about 2010; winter temperatures have not dropped as low in recent years, but peak summer temperatures have been reduced. (This is not to say that the two effects have cancelled each other out - far from it, as the first chart above demonstrated.)

There are at least a few possible explanations for the apparent cooling trend in peak summer temperatures at the upper ground levels at Fish Creek. Of course there could be systematic error or bias, perhaps from vertical displacement of the instruments over time due to freeze-thaw processes - although the Fish Creek site is not listed as one that experienced a lot of vertical "jacking". Systematic trends may also have been introduced by changes to vegetation; perhaps increased growth has provided more efficient shading of the ground surface.
Another possibility is that summer cloud cover has increased over the period of record, leading to a loss of very sunny days at the warmest time of year. A cursory look at the solar radiation data from the Fish Creek site supports this hypothesis, and I'll look into it for another post.
It's worth noting that the other sites with mostly complete data show mixed results in terms of the annual maximum temperature trends. The data from Umiat show a very similar pattern to Fish Creek, but the others do not. Note that there is a certain amount of missing data at all these sites and this undoubtedly affects the analysis of annual extremes (i.e. if you miss a few days, it can make a big difference).


For the sake of completeness, here are the mean temperature results from the sites with reasonably complete data. The acceleration in warming at Tunalik and Inigok is rather striking, although the Inigok results are definitely affected by missing data for most of the winter of 2014-2015. Accelerating warming at Tunalik is more plausible, as this site is the farthest west in the USGS array and sits close to the rapidly warming Chukchi Sea.


No comments:
Post a Comment