As very unusual cold persists in western and south-central Alaska this weekend, it's worth revisiting a statement I made in last Saturday's post about the typical impacts of La Niña on Alaska winters. I suggested that Alaska gets more cold out of La Niña than might be expected from temperatures aloft (well above the surface), because of a propensity for clear skies and calm winds that facilitate surface cooling.
After taking a quick look at some data, I'm no longer as confident about this, although more could be done to examine the hypothesis. Consider the chart below, showing the relationship of Fairbanks surface (2m) temperature to 1000-500mb thickness in December through February. (1000-500mb thickness is a good measure of the average temperature in the lowest half - by mass - of the atmosphere.)
The correlation between temperature and thickness is high, and it's clear that strong La Niña events tend to produce cold winters. However, there is no compelling departure from the overall relationship during La Niña. I was expecting to see surface temperatures lying mostly below the trend-line for La Niña winters, which would have indicated that the surface is systematically colder than temperatures aloft would normally dictate. But in fact it looks like surface temperatures are generally in line with upper-air temperatures; La Niña winters are - on average - equally cold aloft and at the surface in Fairbanks.
On the other hand, there is a slight hint that the strongest El Niño winters are a bit warmer at the surface than would be expected, with only 3 of 10 strong El Niño winters lying below the trend-line, and 6 of 10 above.
In an ideal world, the next step would be to look at wind speed and cloud cover data from Fairbanks, but the long-term historical record is not really suitable for this kind of analysis over many decades, because instrumentation and measuring practices have changed. Gridded reanalysis data is probably a better bet, and ERA5 does show an indication that strong La Niña winters are often less windy than strong El Niño winters across the central and northern interior - see below (La Niña top, El Niño bottom). But it's a rather weak signal that reverses sign for south-central Alaska, and Fairbanks is close to the transition zone.
As for cloud cover, I only looked at ERA5 solar radiation, and of course the big caveat here is that the December-February signal is largely dominated by February. With that said, it looks like clear skies are indeed slightly favored near Fairbanks in strong La Niña winters, but again the signal is weak. ERA5 does have a cloud cover variable, but I haven't obtained that data yet.
So in summary, my hypothesis about cold being focused at the surface during La Niña winters can be put on hold, although I'd like to dig in a bit more before dropping it completely.
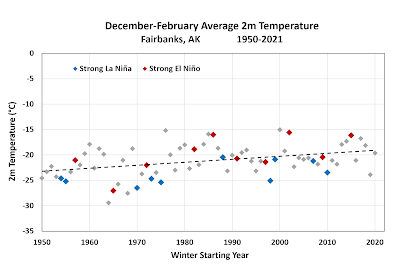
As an aside, the charts below show the 70-year history of Dec-Feb surface temperatures and 1000-mb thickness, with the strong ENSO years indicated. The ENSO state is actually more strongly correlated, in a linear sense, with thickness than with surface temperature, and the charts confirm this: there's almost no overlap between the opposite ENSO states in terms of 1000-500mb thickness (when compared to trend), whereas several of the winters were near-trend in terms of 2m temperature. In particular, strong La Niña apparently provides a high probability of notably below-trend thickness.


I'll offer a guess and suggest the depth (thickness?) and frequency of temperature inversions is greater during La Nina winters in Fairbanks. Lately there have been winds (both forecast and observed) over the surrounding hills and to the south along the Tanana River (the Jet), but little influence has been felt in town. I'll not speculate as to why vs ENSO.
ReplyDeleteFor example today under clear skies local power plant exhaust goes straight up then turns flat to follow the prevailing NE winds above our inversion.
Gary
Above I meant to suggest the thickness above was less and the frequency of inversions more frequent during La Nina winters. The 850mb temps have been cold this winter.
DeleteGary
Thanks Gary, good comments. Clearly the character of the surface-based inversion is critical to valley-level conditions; it's a worthy topic for further investigation.
DeleteI guess the next step might also be to characterize or compare this Fall-Winter wx trend with historical events. As in how frequently does a cold November precede a warm/snowy or cold/dry December-March? I think about this as an arrow once sent tends to follow a repeated path. We are of course subject to Asian weather patterns that apparently force our current cold regime from the WNW.
DeleteGary
This comment has been removed by the author.
Delete