Showing posts with label Winter. Show all posts

Wednesday, February 4, 2026

Cold and Snow Correlation

Last week I alluded to the linkage between the Pacific Decadal Oscillation and seasonal snowfall in Anchorage, with a negative PDO phase often producing increased snow relative to normal.  Of course the PDO also influences seasonal temperature variations - a negative PDO typically brings colder conditions to Alaska, especially in the south.

These twin correlations imply that seasonal mean temperature and snowfall are also correlated to each other in Anchorage: increased snowfall tends to accompany cold.  Here's a chart illustrating this relationship in the last half-century.


I thought it would be interesting to look at the snow/temperature relationship elsewhere around the state.  I started by examining ERA5 reanalysis data, but it's not particularly helpful: it actually suggests a positive correlation in the Anchorage area, presumably because the model's resolution is inadequate (i.e. the results reflect the influence of conditions at higher elevation).


However, one region where the model likely gives a good picture of the low-elevation snow/temperature relationship is in Arctic Alaska.  In the far north, warmer conditions are favorable for increased winter snow, simply because of increased availability of moisture.  This is supported by data from Utqiaġvik up until measurements ceased in 2019: warmer winters tend to be more snowy.


However, historical data from Kotzebue and Nome do not have a positive correlation, despite what the model says.


How about the interior?  The relationships are weak, with little correlation, although there's a suggestion that the warmest winters tend not to be very snowy in McGrath and Fairbanks (especially the latter).  Particularly for Fairbanks, this presumably reflects the drier weather that occurs when the pattern favors warm downsloping/chinook winds from the south and southeast.


Data from Bethel suggests a hint of a negative correlation like Anchorage: more often than not, colder-than-average winters are also snowy.


Turning to Southeast Alaska, Juneau shows a robust negative correlation, as we would expect for a much warmer climate where unusually warm winters tend to be more rainy than snowy.


These charts probably give a good sense of how seasonal snowfall is likely to trend over time if Alaska's climate continues to warm in future decades.  Broadly speaking, we would expect winter snow accumulation to diminish in the low-elevation south and to increase in the Arctic, while the interior may remain relatively unchanged.  But of course large annual and decadal variability will continue, and there may be long-term circulation changes (e.g. related to the PDO) that have significant impacts on long-term trends.

I'll be happy to add charts for other locations upon request (if the data is adequate).

Tuesday, September 23, 2025

First Snow, and North Pacific Warmth in Winter

Fairbanks saw its first snowflakes of the season today, just a few days earlier than normal.  Temperatures were above freezing and no accumulation occurred in town, but the scene looked a lot like "late autumn" in the hills.  Here are a couple of webcam views from Cleary Summit on the Steese Highway shortly after 9am today:


On another topic, reader AlexG asked whether this summer's extreme North Pacific warmth is likely to have an effect on winter in Alaska.  It just so happens that I gave a talk related to this question 10 years ago at UAF, and here's a link to the slides from that occasion:

https://s2s.worldclimateservice.com/wcs/uaf_sep2015_north_pacific_sst_blob.pdf


The winters of 2013-14 and 2014-15 both saw a tremendous amount of warmth in the northeastern Pacific, and that sea surface temperature anomaly became known colloquially as the North Pacific "blob".  In a 2015 paper, Dennis Hartmann of the University of Washington discussed a mode of natural variability - the North Pacific Mode - that resembled the "blob" pattern, and my 2015 talk looked into its connection to Alaska winter climate.

The bottom line from this work of a decade ago is that a positive North Pacific Mode (warm ocean) is linked to unusual winter warmth in most of Alaska except the Southeast, and it also favors wet rather than dry conditions in most areas.  The link with winter precipitation is strong in interior Alaska, because a positive NPM is associated with stronger westerly flow and less chinook flow from the south.

The other major mode of North Pacific temperature variability is of course the Pacific Decadal Oscillation (PDO), which is also closely linked to precipitation across interior Alaska and to temperatures statewide.  A negative PDO phase, which is what we have at the moment, tends to bring wetter winters to the interior (like the +NPM) but colder temperatures statewide (generally opposite to the +NPM).

Here are the canonical sea surface temperature (SST) patterns associated with positive NPM and PDO phases:


Note that the PDO and NPM are independent of each other, so a positive NPM can readily coincide with a negative PDO, as this year.  Also, a negative PDO doesn't necessarily imply cooler than normal SSTs in the northeastern Pacific; the mode expresses the spatial contrasts/gradients in SST rather than the absolute values.  This year's negative PDO phase has been very much driven by extreme warmth near and east of Japan, rather than cool water along the coast of North America.

If we look at previous winters with the +NPM/-PDO combination in the North Pacific, we see - as expected - a strong indication of above-normal precipitation across most of Alaska to the north of the southern coastal regions (where it tends to be dry), and there's also a fairly robust cold signal that apparently reflects the dominance of the PDO influence.  The fundamental circulation anomaly involves unusual high pressure (or equivalently, less low pressure) over the Aleutians, producing a stronger component of westerly flow across central Alaska.


Of course we don't yet know whether the North Pacific SST patterns will remain similar until winter and throughout winter, and indeed there's a good chance they won't.  It's therefore worth examining past years when the +NPM/-PDO combination occurred in summer, rather than assuming it will persist unto winter.  Here's the result:


Interestingly, the precipitation signal is very similar, but the cold signal is much weaker in the summer "analog".  This seems to be because several of the summer matching years ended up with El Niño and/or a near-neutral PDO phase during the subsequent winter, thereby changing the remote influences on the circulation patterns near Alaska.  In contrast, most of the winter +NPM/-PDO matches involved La Niña during winter, reinforcing the cold signal.

And for this winter?  Best estimates are that La Niña will probably prevail during autumn and early winter before fading over the course of the winter; El Niño is very unlikely.  But that doesn't mean it will be cold.  Arguably the most similar recent year in terms of the tropical and North Pacific setup is 2022-23, and that was a warm winter for Alaska (except for Southeast), while the precipitation anomalies matched the +NPM/-PDO pattern very well.


Wednesday, April 9, 2025

March Climate Data

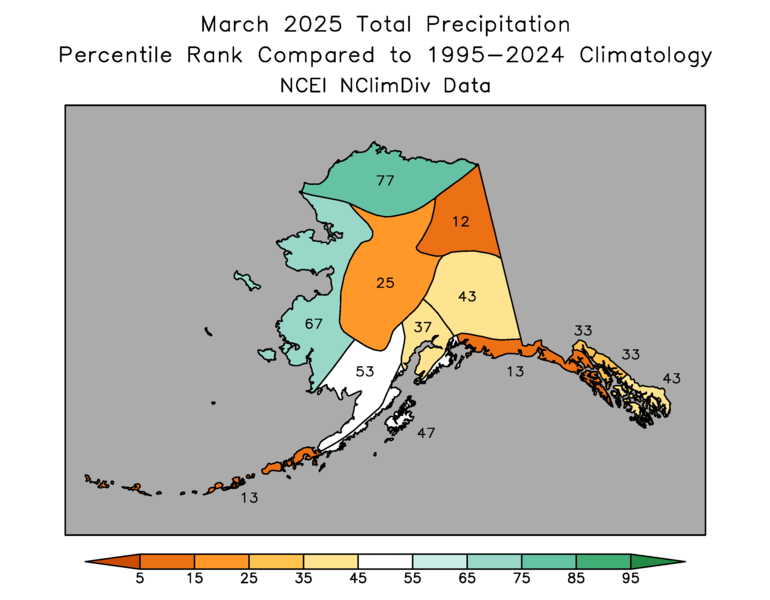
March was another warmer-than-average month for most of Alaska, although not excessively so; it was the 15th warmest March in the NOAA/NCEI history since 1925.  The only region that wasn't warmer than the 30-year normal was the west, and the Bering Strait region was actually significantly colder than normal.  Here are my usual "percentile rank" maps, showing how the month compared to the same month in the past 30 years. 


The monthly average mid-atmosphere circulation pattern isn't what we would usually think of as producing a warm month for the state as a whole: a ridge to the north and a trough over the Gulf of Alaska tends to be a colder pattern in the cold season.


However, there were tremendous changes in the flow orientation through the month.  The first 10 days were very warm owing to a Bering/Aleutian trough (a typical warm pattern), but this reversed to an Aleutian ridge by late in the month.  Here are 500mb height anomaly maps for one-third portions of the month:


It seems that the northern Bering Sea and Bering Strait region managed to remain north of a frontal zone for much of the month, and so Arctic air dominated that region and kept temperatures relatively low.  The persistent frontal zone can be seen on a map of solar radiation, which was below normal (i.e. above-normal cloudiness) from the central Bering Sea to Bristol Bay:


March precipitation was below normal for more of Alaska than it was above normal, and according to NCEI both the Northeast Interior and Northeast Gulf divisions were significantly drier than normal for the second month in a row.


Given that March is typically a dry month, the precipitation anomalies made relatively little difference to the snowpack, which remains quite similar to a month earlier - although the positive anomalies have generally diminished in the western and northern interior.


Snowpack remains seriously lacking in the southwest, parts of South-Central, and the Seward Peninsula, according to ERA data:


Winds were lighter than normal for large parts of the state in March, which makes sense in view of the overall circulation anomaly (ridge to the north, trough to the south).


The extended winter period of November through March ended up as the sixth warmest on record - not as anomalous as December through February (third warmest).  November was the coolest month relative to normal (although still not cooler than normal), and January was by far the warmest and wettest.


The North Slope climate division had its third warmest November-March, trailing only 2017-18 and 2018-19, and the Northwest Gulf was fourth warmest on record.  In the case of southern Alaska, it's worth considering again how remarkable it is that this kind of warmth can prevail with a significantly negative PDO phase, although admittedly the PDO index did rise to neutral by the end of March.  Here's a chart of the PDO index for the last decade or so (click to enlarge).


Precipitation for the extended winter season was above normal for most of the state except the Panhandle, largely because of January; but as noted above, this generally only produced a good snowpack to the north of the Alaska Range, because of all the warmth (again, especially in January).


Monday, March 10, 2025

February Climate Data

NCEI and ECMWF have updated their climate data for February, so we can have a look back at last month and also the traditional climatological winter season of December-February.

February was the "least warm" month of winter for Alaska as a whole, but it was still warmer than the 1991-2020 average across most of the state's land area.  It was especially warm in the west and southwest, and quite warm on the North Slope too:


The obvious difference from December and January was in the Southeast, where February was colder than normal, and quite significantly so in the southern Panhandle.  This change occurred because instead of a ridge over western Canada, February saw a trough from the north-central Pacific to southern Canada, and the flow orientation brought cold interior air to southeastern Alaska.  November was somewhat similar, with Southeast being colder (relative to normal) than the rest of the state.


For Alaska as a whole, December-February was the 3rd warmest such period in the NCEI climate data history (1925-present); only 2000-01 and 2015-16 were warmer.  While unusual warmth was universal across Alaska, it was most pronounced for the Alaska Peninsula and the northwestern Gulf coast.  Both Cold Bay and Kodiak had their second warmest Dec-Feb on record (2013-14 and 2014-15 were the warmest at these two sites respectively).


While February didn't mark a dramatic break with earlier warmth in most of the state, the precipitation contrast between January and February could hardly have been greater, as nearly all of the state was drier than normal in February.  In southwest and south-central areas the deficit was really unusual; Anchorage saw its driest February on record, and according to Rick Thoman several locations in the Palmer area reported no measurable snow at all.  This is really remarkable, following January's onslaught of moisture.


January was so wet that despite February's dryness, large parts of the state were significantly wetter than normal for Dec-Feb overall.  According to ERA5 model data, only the North Slope was notably dry, but the NCEI February estimate strongly disagrees on this.  Given the paucity of reliable ground-truth winter precipitation data, I would tend to trust ERA5 more, but Utqiaġvik did report over an inch of liquid equivalent, almost enough to be in the top 10 for Dec-Feb precipitation.


As of the end of February, snowpack was very healthy for monitored areas in the western and northern interior, but major deficits are evident in South-Central.  The Iditarod start was moved to Fairbanks for the 4th time (other years 2003, 2015, 2017).


ERA5 snow data shows a similar north-south contrast in snowpack fortunes:


The lack of snow in southern areas increases the risk of early season wildfires, and that has been reflected in the fire potential outlook:


Burn permits will be required beginning just one week from now across southern Alaska:


Finally, I'll close with ERA5's estimate that the Dec-Feb season was much windier than normal across the northern half of Alaska (see below).  This is broadly consistent with the warmth, as winds tend to mix out the surface-based inversion that is associated with valley-level cold; but the relationship is quite weak and is very elevation-dependent.  See here for some previous results on the temperature-wind correlation in the model data: