In the past week I've been thinking about temperature volatility and the fact that it tends to be higher in Alaska winters during La Niña, when colder conditions are favored overall. This suggests a possibility that cold weather regimes are inherently less stable and persistent than relatively warmer weather regimes; so you're more likely to see similar conditions persist when it's warm than when it's cold.
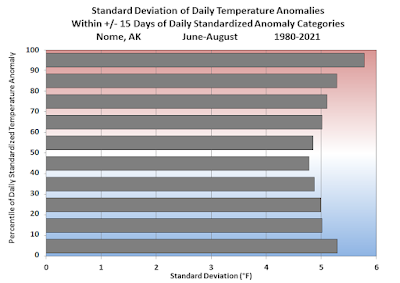
But does the data support these conjectures? To address this, I took the daily mean temperature in Fairbanks winters from 1980-2021 and calculated the daily standardized departure from normal, i.e. the difference from the 1981-2010 normal (for convenience) in terms of standard deviations. I then sorted the more than 6000 daily values into 10 equally populated categories, and finally for each category I calculated the standard deviation of temperature within +/-15 days of each individual day. Here's the result:

This shows that, for example, the standard deviation is over 15°F within +/- 15 days of the coldest 10% of Fairbanks days in November-March. This is the highest variance of any of the categories and supports the hypothesis that the highest volatility occurs when it's much colder than normal. However, the variance is also enhanced when it's very warm - but not quite as much as when it's cold.
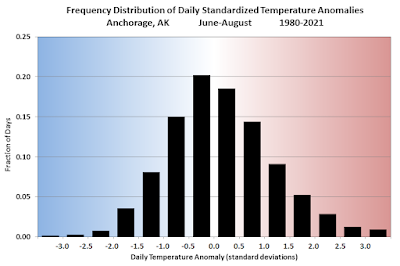
Thinking a bit more about this, the result above is partly a reflection of the slight negative skew in winter daily temperatures in Fairbanks. Here's a histogram of the daily standardized temperature anomalies: the median is slightly above zero, because I used an outdated 1981-2010 normal, and the distribution has a slightly longer tail on the cold side.

In a situation with negative skew, it's clear that negative departures tend to be larger in magnitude than positive departures, and that's the same thing as saying that the variance is higher on the cold side.
However, there's a bit more to this than just skew: I also calculated the frequency with which the temperature reverses to the other side of normal in the next 15 days, for both the coldest and warmest categories of daily temperature. When temperatures are in the lowest 10%, there's a 9.0% chance of an above-normal temperature occurring within the next 15 days, but when temperatures reach the highest 10%, the frequency of below-normal within 15 days is a bit less, at 8.5%. So this too reflects the fact that cold gives way to warm slightly more often than warm gives way to cold.
Interestingly this "sign reversal" statistic is very similar for summer in Fairbanks: 9.5% versus 9.0% (cold to warm versus warm to cold, respectively). However, the skewness is almost zero in summer, and there's no difference in variance between the coldest and warmest decile categories.


| Winter | Cold to Warm | Warm to Cold |
| Fairbanks | 9.0% | 8.5% |
| Anchorage | 9.1% | 8.4% |
| Juneau | 8.9% | 8.0% |
| Utqiaġvik | 8.3% | 8.6% |
| Nome | 8.6% | 8.9% |
| Summer | Cold to Warm | Warm to Cold |
| Fairbanks | 9.5% | 9.0% |
| Anchorage | 9.0% | 8.7% |
| Juneau | 9.4% | 9.5% |
| Utqiaġvik | 9.6% | 9.1% |
| Nome | 9.3% | 9.5% |
No comments:
Post a Comment