I ended up digging into this, and I've succeeded in producing an archive of integrated storm activity back to 2014. The Fairbanks (Pedro Dome) radar has been around for a lot longer than that of course, and there is some historical data available back to 1997, but unfortunately there is just too much missing data in the early years to use it in this analysis. There's also a complete gap from 2004 through 2013, and regrettably NOAA/NCEI says that data does not exist any more.
But we'll work with what we have. My approach was to calculate the spatial area for which the radar reflectivity exceeded various thresholds at each radar scan, across the entire available scan domain, as archived in NOAA's Big Data project. I used the base (lowest scan elevation) reflectivity and extracted the data on a 1km grid.
There is a myriad of ways that the results could be analyzed, but for starters I took the May-September average of each day's maximum area at or above the reflectivity threshold - such as 40 dBZ, see below. A 40 dBZ reflectivity is typical of moderate convective rainfall in summer; a typical robust thunderstorm core would be more like 50 dBZ.
The overall year-to-year variability in 40+ dBZ radar echoes does not seem particularly great, but the monthly breakdown shows that both July and August of the last two summers were considerably more active than the decadal average.
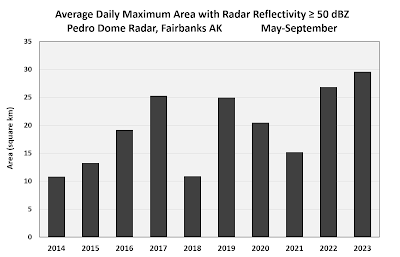
Raising the bar to a 50 dBZ threshold emphasizes the high level of storm activity in the past two summers, especially in July (both years) and August (this year). August 2023 actually stands out quite dramatically compared to the previous 9 years:
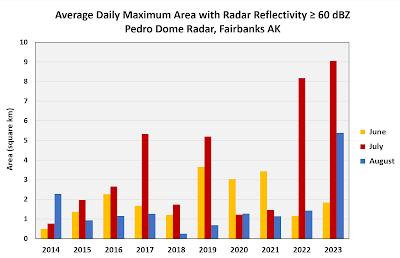
Taking it up still another notch to 60 dBZ, which would be typical of a strong storm producing at least some hail (possibly large), summer 2023 stands out even more compared to prior years, and there's a strong suggestion of an upward trend. Despite the very short period of record, the linear trend in the first chart below is highly statistically significant.
This data obviously begs for further analysis and investigation, and I'll aim to do that as time permits. For now, it's just interesting to note that perhaps the unusual spate of severe thunderstorm warnings issued by NWS Fairbanks this summer wasn't as out-of-line as I thought at the time.


No comments:
Post a Comment