Saturday, August 13, 2022

July Climate Data

This is a few days late, but here's a look back at the climate anomalies for July.  The monthly mean circulation pattern was dominated by an unusually strong trough near the Bering Strait, but remarkably this pattern only occurred for about a week shortly after the middle of the month - but the trough was so anomalous that it overwhelmed the more mundane features in the rest of the month.  I wrote about the "Arctic vortex" at the time:

http://ak-wx.blogspot.com/2022/07/arctic-vortex.html


The ridge to the south of Alaska was associated with extremely warm SSTs in the central North Pacific:


Alaska's statewide average temperature took a big dive just before the middle of the month in association with the pattern change, mercifully bringing an end to the fire season.  Here's the UAF/ACCAP temperature index zoomed in for July:

Generally the northwest of the state was a bit cooler than normal overall for July, but Southeast Alaska was slightly above normal.  As for precipitation, it was below normal in the eastern interior but above normal in the west, and much above in parts of south-central Alaska.  The change to wet in the south-central and southwestern mainland was enough to quickly erase early summer drought; it was a dramatic change.  Graphics below are from Rick Thoman's Twitter feed:


Below are my usual rank maps based on the NOAA/NCEI climate division data.  Disregard the significantly colder than normal result for the North Slope division: I don't believe it's correct, and this isn't the first time with a problem in the preliminary North Slope temperature number.  The precipitation rank (higher than anything in the last 30 years) is more reasonable: Utqiaġvik saw a remarkable 1.42" of rain on the 26th, the highest 24-hour precipitation amount on record, with data back to 1920.  It's an astonishing amount of rain for the location.


To complement the picture with much better detail, here are the ERA5 reanalysis maps; it's interesting to see the contrast between warmth in Norton Sound and cold in Chukotka and the western Chukchi Sea.


Wednesday, August 10, 2022

Snow and Cold Notes

Following up briefly on yesterday's post, 2.0" was the official snow measurement from Denali Park HQ yesterday.  This is actually fairly remarkable: in a century of climate observations, the earliest date with 2" of snow in one or two days was more than two weeks later: August 26-27, 1984.  The latest in the spring with such an event was June 18.  The only measurable snow recorded in July was 1.0" on July 17, 2003.

Yesterday is also the the only time with more than an inch of snow reported on the ground at the daily measurement time in either July or August: the previous earliest in the season was September 2, 1980.

The cold air mass also produced some notable freezes this morning, including 21°F at Chicken, 26°F at Eagle airport, and mid to upper 20s at many RAWS locations.  The 21°F in Chicken is the coldest on record for this early in the season, although there's only 25 years of data.  Previously the coldest observed in Chicken between June 15 and August 15 was 24°F, and perhaps surprisingly a sub-20° reading hasn't been observed prior to August 29 (2012).

On another note, it's also quite remarkable to see that persistent cold over the western Chukchi Sea has allowed sea ice to linger this summer along the Arctic coast of far eastern Russia, and in recent days some ice has made its way down through the Bering Strait.  Here's the latest NWS ice analysis:

The NSIDC commented recently that it seems unlikely that the Northern Sea Route will open up this year, so that will presumably help avoid a fiasco like last year with unprepared ships getting stuck at freeze-up.


Tuesday, August 9, 2022

Deja Vu

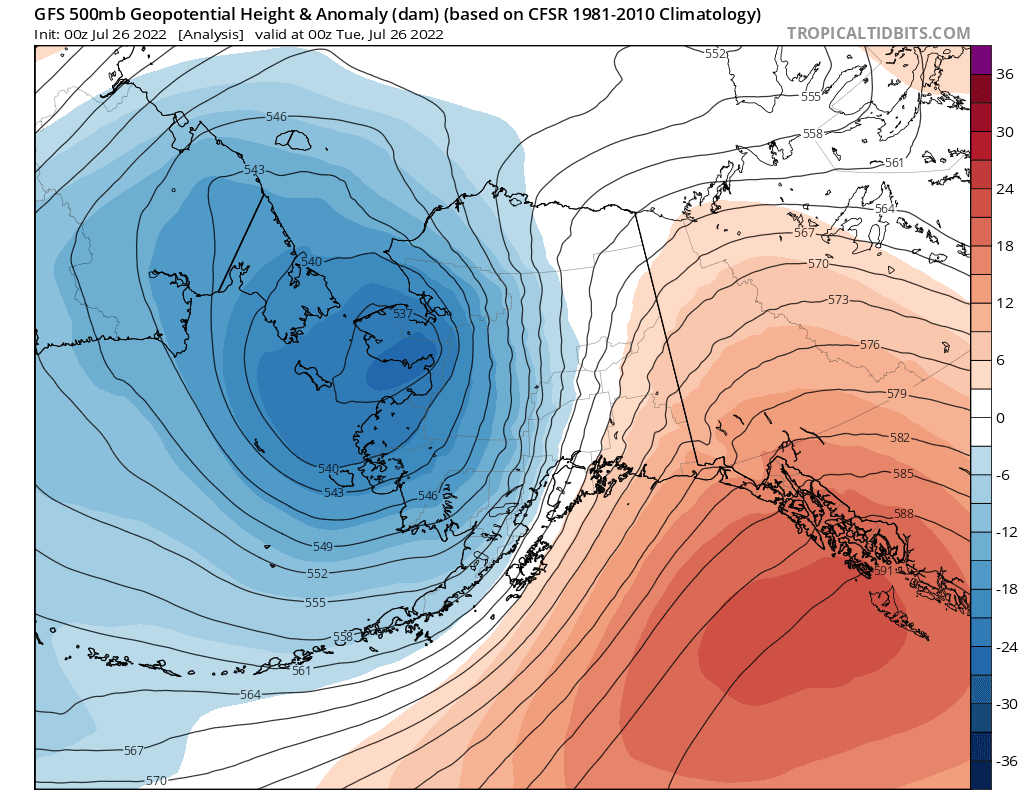
Fairbanks is cleaning up again today, after another round of strong winds produced more power outages just two weeks after the severe wind storm of late July.  The latest storm is remarkably similar, consisting of a very strong mid-atmospheric vortex near the Bering Strait and a powerful blast of cold air that raced eastward across the state yesterday and early this morning.

The first map below shows the 500mb analysis from 4am yesterday; compare this to the map from 14 days earlier (second map below).  For more on the last storm, see my previous post.


The winds were not as severe with this event as with the last one, but the air mass was colder.  Remarkably, the Bethel balloon sounding reported an 850mb temperature of -4.3°C yesterday afternoon, which is one of the lowest measurements this early in the "autumn".  Fairbanks measured -3.9°C at 850mb this morning: also a rare level of cold this early, with the only comparable event in the last 40 years being -3.3°C on July 28, 2000.

It's no surprise, then, that snow was falling this morning in Denali NP and no doubt many other elevated locations.  And not just a dusting: check out videos and photos below.


Rick Thoman reports that this is only the 4th occurrence of accumulating snow at Denali HQ between June 15 and August 15 (data since 1923).

Temperatures dipped just below freezing at the Wonder Lake CRN in Denali NP, and several sites along the Kuskokwim River were below freezing this morning, including 28°F at Sleetmute and 30°F at Kalskag.  But it's still summer, albeit the cool variety: Sleetmute was back up to 61°F this afternoon.

Here's a sequence of 850mb temperature maps from 4am Sunday to 4am today.


Friday, August 5, 2022

A World of Difference

The last 3-4 weeks have seen a remarkable turnaround in weather fortunes for much of Alaska, with dramatically wetter - and considerably cooler - conditions bringing a very welcome end to the wildfire season.  Compare the two 30-day precipitation anomaly maps below: the top one showing the situation as of a month ago, and the latest analysis on the bottom.


On July 5, 18% of Alaska's land area was classified as having moderate or severe drought, according to the U.S. Drought Monitor, but now drought remains in only a small area (less than 1%) just to the south of Fort Yukon.


Reader Gary commented that "it seems like August in July for Interior Alaska", and indeed the change to notably wetter and cooler weather is very typical for August.  I've pondered whether it would be possible to identify a sudden regime shift that marks this transition in many years; it would be nice to measure the change in an objective way, and look at how the transition varies from year to year and from decade to decade.  For example, has it become earlier over time?  Any suggestions from readers would be welcomed.

In the absence of objective criteria to define an August-like "regime shift", I thought it would be interesting to look at the timing of the warmest week of the year in Fairbanks: see below.  Early July is the most common time for the warmest week to occur, like this year, but there is a lot of variability, with some years seeing the warmest week in early August or before the middle of June.  There's a hint of a trend towards earlier peak warmth, although it's certainly not statistically significant.


A much more significant trend is evident if we look at the wettest week of the year in Fairbanks, based on rain amounts only (I've excluded weeks with any measurable snowfall).  The timing of peak rains really has changed a lot: prior to about 1970, the wettest week was more often in August or September than in July, but in the past 20 years it has become rather unusual to see the peak in August, let alone in September.


From this perspective, then, it does look like the transition from dry spring weather to wet "late summer" weather has become earlier over time.  But we should also recognize that changes in July rainfall have been dominated by an increase of infrequent but heavy events, as discussed elsewhere on this blog (e.g. here), and this is not necessarily the same thing as the August wet regime arriving earlier (i.e. July rains are more convective, whereas August is typically more stratiform).

Another intriguing angle on the timing of the regime shift is found in the midpoint date for the wildfire season: see below for one of Rick Thoman's excellent Twitter graphics.  Only 30 years of data are available, but there's a hint of a trend towards earlier fire season midpoints.  Interestingly this season was a big one (over 3 million acres burned), and yet its midpoint was on June 30 (assuming acreage does not increase much from here).  No other year in the series had both a large acreage total and a relatively early midpoint.


That's enough speculation for one post.  But for the sake of completion, here's the timing of the coldest week in Fairbanks.  Given the profound warming throughout the Arctic in autumn and early winter, it's no surprise to see that it has become less common for Fairbanks to have the winter's coldest weather before the turn of the year.


Tuesday, July 26, 2022

Out of Season Windstorm

Yesterday brought some wild and highly unseasonable weather to southern and interior Alaska, as an extremely powerful cold front blasted east across the state in connection with the intense vortex that is still spinning near the Bering Strait (see the last post).  Indeed the mid-atmospheric cyclone was re-energized in a big way from a new low pressure system that developed within a frontal zone stretching along the Aleutian chain, and this new surge of energy is what pushed the front so vigorously into the interior.  Here's a sequence of 500mb maps from Saturday afternoon through this morning at 12-hour intervals:


The eastward progress of cold air aloft is visible in the 850mb maps below, at 6-hour intervals from 10am yesterday to 10am today.  The location of the front was at the leading edge of the cooler air, passing through Fairbanks around 7-8pm yesterday evening.


The front will long be remembered in Fairbanks for the damaging winds that occurred with its passage, gusting to 44mph at the airport and 46mph at Fort Wainwright.  Power was knocked out for many thousands of homes and "untold property damage" occurred, to quote the News-Miner.  Remarkably, true chinook winds occurred earlier in the day farther up the Tanana Valley, peaking at 63mph at Delta Junction and around 70mph at a few sites nearby.  This is all very remarkable for the time of year, as there is rarely enough of a pressure gradient to generate widespread strong winds at this season.  (Of course strong winds are quite rare in winter in Fairbanks too, owing to the strong temperature inversion, but high winds occur frequently in the hills and many other valleys.)

Here's the 4pm sounding from Fairbanks yesterday, prior to the arrival of the front.  The wind barbs on the right show very strong flow from a SSW direction aloft, and the temperature profile shows a steep lapse rate through a very deep layer, greatly aiding the downward transfer of momentum to the surface (i.e. the opposite of a temperature inversion).


The sounding's reported wind speed of 56 knots at 700mb (nearly 10,000 feet elevation) is the highest 700mb wind speed on record for Fairbanks in June or July.  Interestingly, both 2018 and 2019 saw similar 700mb wind speeds in early August, but those were big rain events with upper-level winds from a more westerly direction and with much less steep lapse rates and much less wind at the surface.  Here are those soundings:


If we look at only 700mb winds from a southerly quadrant (southwest through southeast), yesterday's event had easily the highest wind speed on record for summer in Fairbanks (data back to 1948).  No other sounding reported 50 knots or higher from a southerly quadrant between April 10 (1956) and September 5 (2012), so from this perspective yesterday was an unprecedented event in at least the last 75 years.  With trees still having full foliage, the extent of the damage is no surprise.

Saturday, July 23, 2022

Arctic Vortex

After an astonishing outbreak of wildfire in southwestern Alaska earlier this summer, the weather has changed dramatically.  The past few days have been chilly, and this morning many locations around the Bristol Bay region were in the 30s, with some close to freezing - notably 33°F at the Aleknagik CRN near Dillingham and also at Koliganek.  Also worth noting is the 31°F yesterday at the CRN site on St. Paul Island; this is the first sub-freezing temperature there in July since 2012.

The mean daily temperature plot from Bethel (below) shows that the cool conditions are not as unusual as the heat was in early June.  Nevertheless, yesterday's high temperature of only 49°F in Bethel is right at the lower end of what's been observed historically for the time of year: the daily record low maximum temperatures (i.e. coldest daytime highs) are mostly around 49-50°F from mid-July through mid-August.


The cool weather can be attributed to a very strong mid-level low pressure system that dropped down from the Arctic.  The mid-atmospheric cyclone can be traced back to the central Arctic, and arguably it is THE summertime tropospheric polar vortex that moved down to the Bering Strait.  Here's a simple animation of 500mb heights at 12-hour intervals since the beginning of the month.


The vortex has been extremely strong for the time of year, and remarkably it set new records for lowest 500mb height in the month of July for quite a number of locations from the central Arctic to the Bering Strait (based on ECMWF and ERA5 data).


As for the larger significance of such an event, random variability plays a large part in the formation of a feature like this, but I'll also note that the dramatically cooler weather is finally more reminiscent of a typical La Niña pattern for summer, as noted in this ill-fated blog post from early June.

http://ak-wx.blogspot.com/2022/06/wildfire-outlook.html

[Postscript: here's a photo of snow on Big Diomede island in the Bering Strait on Monday]

Monday, July 18, 2022

Weather Relief

I'm traveling at present and can't comment in detail, but major weather relief has arrived at last when it comes to Alaska's nasty fire and smoke season.  A change of pattern was advertised well in advance by the Climate Prediction Center, and widespread rainfall has been a big help for fire-fighting efforts.  Here's a temperature anomaly plot for Fairbanks and the latest 7-day precipitation analysis from the NWS:


The 30-day departure from normal analysis (below) now shows some green across southern Alaska, but notice how much brown there still is on the 90-day anomaly map (also below).  The drought isn't over yet.


Returning to the topic of lightning, a few days ago I witnessed an impressive night-time display of lightning in Florida, and I got to thinking about the contrast in lightning density between the two states: Florida having the most lightning per square mile, and Alaska the least.  Based on the BLM/ALDN data, Alaska's peak lightning density has been about 5 strikes (cloud or ground) per square km over about 11 years, i.e. approximately 0.5 strikes per km2 per year; this lightning hotspot is just to the north of the Alaska Range, roughly between Minchumina and Healy.


In contrast, the entire state of Florida averages about 7 strikes per km2 per year, according to a 10-year study from Vaisala, and some areas have considerably more.  So even the most lightning-prone parts of Alaska don't come close to what's considered normal in the so-called Sunshine State.  As far as I'm concerned, less lightning is always better, although it can be a visual spectacle: here's a video taken by my daughter last Wednesday evening as we were driving in Florida (apologies for inferior quality).  It would be interesting to dig through the Alaska lightning data to find the single most prolific lightning storm and see how it compares to these flash rates.