Thursday, January 11, 2024

December Climate Data

Looking back at December, the dominant circulation feature near Alaska was a pronounced Bering Sea trough, with 500mb heights significantly below normal over western Alaska.  And so it was another wet month for the state - the 8th wettest December on record (1925-present), according to NOAA/NCEI data.  By my count, every month in 2023 except October was wetter than the long-term median for Alaska as a whole, and it was the wettest year statewide since... last year.


December's mid-atmosphere flow pattern was quite reminiscent of a typical El Niño outcome.  The map below shows the average 500mb height anomaly for 10 Decembers with strong El Niño conditions.


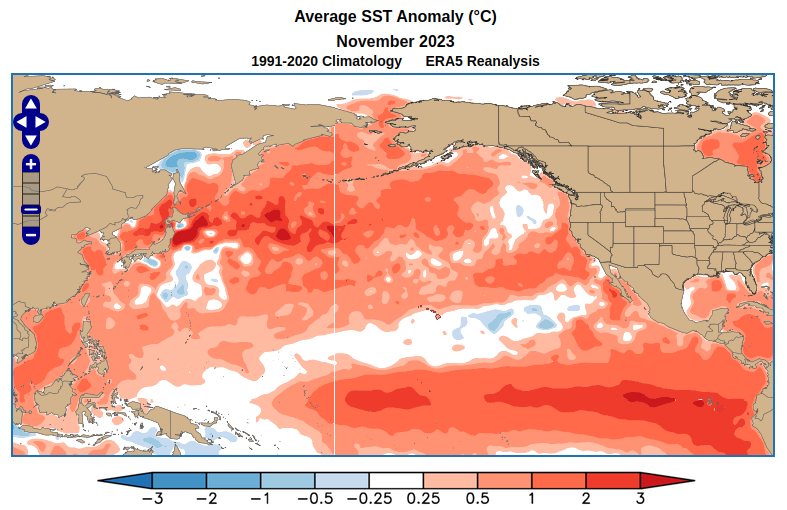
Interestingly, this occurred despite dramatically different North Pacific SST patterns - compare the two maps below.  This highlights the fact that it's tropical SSTs (and associated tropical convection) that tend to drive higher latitude circulation anomalies.  Extratropical SSTs have an important influence in terms of setting a baseline for air temperatures locally and downstream, and they can reinforce prevailing weather patterns (e.g. a trough over locally colder ocean regions), but they can't compete with the likes of a strong El Niño in terms of overall circulation forcing.


Having noted El Niño's large-scale signature in the December circulation pattern, however, there were subtle differences.  The Bering Sea trough was a bit farther north than usual, and that created less warm southerly flow and more cold westerly flow into western and southern Alaska.  Compare the air temperature maps below; the southwestern quadrant of Alaska was colder than would be typical of El Niño.


Here are my usual climate rank maps based on ERA5 and NOAA data:


The Panhandle was exceptionally warm, with only a handful of Decembers being warmer in the modern climate history.  The Southeast warmth was merely the western margin of a vast area of extreme warmth across Canada - the warmest December on record in many places.  Canada is used to relatively warm winters during El Niño, but this was off the charts.

Here's the estimated distribution of precipitation anomalies: much wetter than normal in the Southeast and eastern interior, and either wet or dry elsewhere depending on which data source you prefer.  Given the abysmal state of ground-truth precipitation measurements these days in Alaska, the ERA5 model data is probably preferable. 


Wind was below normal for a large part of the state, which is a bit surprising given the proximity of the trough; but it was evidently a rather stagnant pattern, with the storm track and higher winds taking aim at the Panhandle rather than running up into western Alaska.


As for the Arctic, warmth was extreme on the Canadian side.  For 3 of the sites noted below - Resolute, Cambridge Bay, and Kugluktuk - it was the warmest December on record, and these all have more than 50 years of data.  At Cambridge Bay, with 87 years of data, the previous December record was broken by more than 2°C (-20.1°C vs -22.2°C in 1987).


And as for Utqiaġvik, it was the 3rd warmest December on record, behind only 2017 and 2022.

For more details, Rick Thoman's December summary is well worth a read:


Tuesday, January 9, 2024

Follow-Up

A quick follow-up post on last week's big pressure gradient and associated wind: with ERA5 data now available, the peak MSLP difference between two Alaska land points was 95mb, i.e. not an all-time record, but certainly in the upper tier of these events.

However, I redid the historical calculation for land points from 170°W eastward, i.e. excluding the central and western Aleutians.  The rationale is that last week's Aleutian cyclone was farther east than others that produced extreme pressure differences across the state, and I wanted to see if it might be an all-time record for the more restricted domain.


And the answer is - yes!  The pressure difference of 95mb within Alaska east of 170°W is indeed the greatest back to 1950, based on hourly ERA5 data.  Only two previous events exceeded 92mb across this domain: November 26, 1985, and December 5, 2009.


Here's a revised chart of the annual (cold season) maxima for the smaller domain:


Interestingly there seems to be a slight downward trend in the series, although it's not statistically significant.  Another interesting aspect is the tendency for large positive outliers once every 10-20 years.  Last week's set-up was a rare event.

Most regrettably, the high winds produced by this system led to treacherous conditions high on the Steese Highway last Wednesday, leading to the deaths of two motorists:

https://www.adn.com/alaska-news/2024/01/05/recovery-of-2-found-dead-in-interior-alaska-vehicle-complicated-by-poor-weather-troopers-say/

Conditions were indeed very poor: here's the hourly data from the Eagle Summit SNOTEL site (click to enlarge).  Columns are temperature and wind chill in °F, wind direction, wind speed in mph, and solar radiation (absolute and percent of possible).


I don't have historical data for comparison, and Eagle Summit is notoriously cold and windy, but it's clearly not the kind of weather you want to encounter unprepared.


Thursday, January 4, 2024

Big Pressure Gradient

There's been a very large pressure gradient across Alaska in the past couple of days, reflecting the contrast between Arctic high pressure to the northeast of Alaska and a very strong storm in the eastern Aleutians.  As of yesterday morning, the difference in central pressure between these two features was 100mb, or about 10%.


Strong winds are the immediate result of big pressure differences, and so it's been very breezy in many places across Alaska; blizzard conditions have been occurring for the eastern Arctic coast.

The 100mb pressure difference led me to wonder about the largest pressure difference ever measured across the state of Alaska.  In the current event, the maximum pressure difference between two land points appears to have been around 90-95mb, judging from model MSLP maps - for example this one from Tuesday night (a range of 944mb to 1036mb).


Using hourly ERA5 reanalysis data back to 1950, I determined that the largest MSLP difference was 103mb, on February 4, 1989.  This was a case with strong high pressure over the interior and southern Alaska (at the tail end of the notorious January 1989 cold spell, with record high MSLP), and only a modest cyclone over the Aleutians.


In contrast, just three years ago the MSLP difference across Alaska exceeded 100mb for only the second time since 1950, with an exceptionally strong western Aleutian cyclone being the culprit rather than a very strong anticyclone over the interior.  This event also saw the lowest MSLP on record at an Alaskan land location, 923mb (according to ERA5 data since 1950).


The time series of annual (winter) peak pressure differences shows no significant long-term trend.  The peak pressure differences of each cold season have occurred in all months from November through April, with December being most common.


There's also no significant overall relationship with El Niño/La Niña, although it's slightly intriguing that the strongest El Niño winters have tended not to produce a high pressure difference.  The current event is therefore a bit unusual in this regard, because we certainly have a strong El Niño in play at the moment.


I'll provide an update with the ERA5 peak MSLP difference for the current event when the data is released in a few days' time.

Wednesday, December 27, 2023

Cold At Last

Cold air aloft and clear skies allowed temperatures to drop to the coldest of the season so far across much of western Alaska in the past couple of days, and -40° was breached for the first time at a measuring location in the state.  This is much later than usual.  Several sites dropped below -35°F earlier in the month, including -39°F at the Ruby 44 ESE co-op site, but yesterday's cold was more significant.  Here are some 24-hour low temperatures ending at midnight last night.


The coldest reported (not on the map) was -49°F at the Kaiyuh RAWS near Kaltag.  McGrath reached -45°F, the coldest since the pre-Christmas cold spell of last year.

But more unusually, Bethel reached -30°F, the coldest since February 2017.

In other news, Anchorage snowfall continues to track at record levels, with 79" so far this season.  This is above the normal total for the entire winter.

On a different note, while fiddling with climate data over the break, I took a look at the relationship between temperatures aloft and temperatures at the surface in the depths of winter, for all the major balloon sounding sites in Alaska.  For temperatures "aloft" I used the 850mb pressure level, which averages about 4000-4500 feet above sea level at this time of year.

There's a robust positive correlation, of course, between 850mb and surface temperatures at all locations, but it does vary quite a bit across the state.  The site with the highest correlation of average December-January temperatures is Nome:


The lowest correlation is at Utqiaġvik, but this is at least partly because of the differing trends at the surface and aloft: surface temperatures have warmed more rapidly because of sea ice loss.


In general we expect lower correlations for more interior locations that have strong and near-permanent surface-based temperature inversions at this time of year, and higher correlations at maritime sites where inversions are less common.  This is broadly what we find:


The highly maritime climates of Kodiak, Cold Bay, and St Paul Island are at the top right, with Annette Island also quite similar.  On the far left, with strong inversions, are Fairbanks and McGrath, and these sites have a weaker relationship between surface and 850mb temperatures.  Anchorage is right in the middle.

The only one that surprises me is Yakutat, with a weak correlation despite a rather maritime climate and positive lapse rate (i.e. no temperature inversion on average).  More investigation would be needed to illustrate why this is the case.

Wednesday, December 20, 2023

AI Forecast Follow-Up

Last month I penned a few comments on the big news in the weather industry: the emergence of AI models as a legitimate competitor to traditional physics-based models for weather forecasting.

To provide a more concrete example of the impressive performance of the new models, I pulled out forecasts for Fairbanks from two of the AI models that I've been running over the past couple of months.  Note how remarkable this is: the models can be run on pretty modest hardware; you don't need a supercomputer.

Here's a basic comparison of forecast skill for days 1-14 of the 2m temperature forecasts for Fairbanks (click to enlarge).  Here I'm using ERA5 reanalysis data as "ground truth".


The two AI models are GraphCast (Google) and FourCastNet (NVIDIA), and I'm running FourCastNet with 50 members based on the initial conditions in the ECMWF ensemble forecast.  GraphCast is more computationally demanding, so I only have a single member each day.  The usual (traditional) ECMWF and GEFS ensembles have 51 and 31 members respectively.

Remarkably, GraphCast's single forecast member equals the ECMWF ensemble skill out to 9 days.  The ECMWF ensemble is the gold standard for medium-range forecasting, so this is a terrific result that confirms the power of the new models.  In contrast, FourCastNet starts out strong but roughly equals GEFS after 5 days, with inferior skill.  Note that systematic bias could affect these results to some extent, as I used the ERA5 seasonal normal as the baseline, without any bias correction.

Looking at the mid-atmosphere 500mb height forecasts, it's interesting to note that GraphCast drops off significantly after 10 days, while FourCastNet shows a very strong performance.  This may be reflecting the benefit of an ensemble approach for the medium-range (7-14 day) forecast.


More results will be forthcoming when I have time.  In the meantime, here's the latest forecast I have access to: the message is "warmer than normal" in Fairbanks, and perhaps especially around Christmas Eve and New Year's Eve.


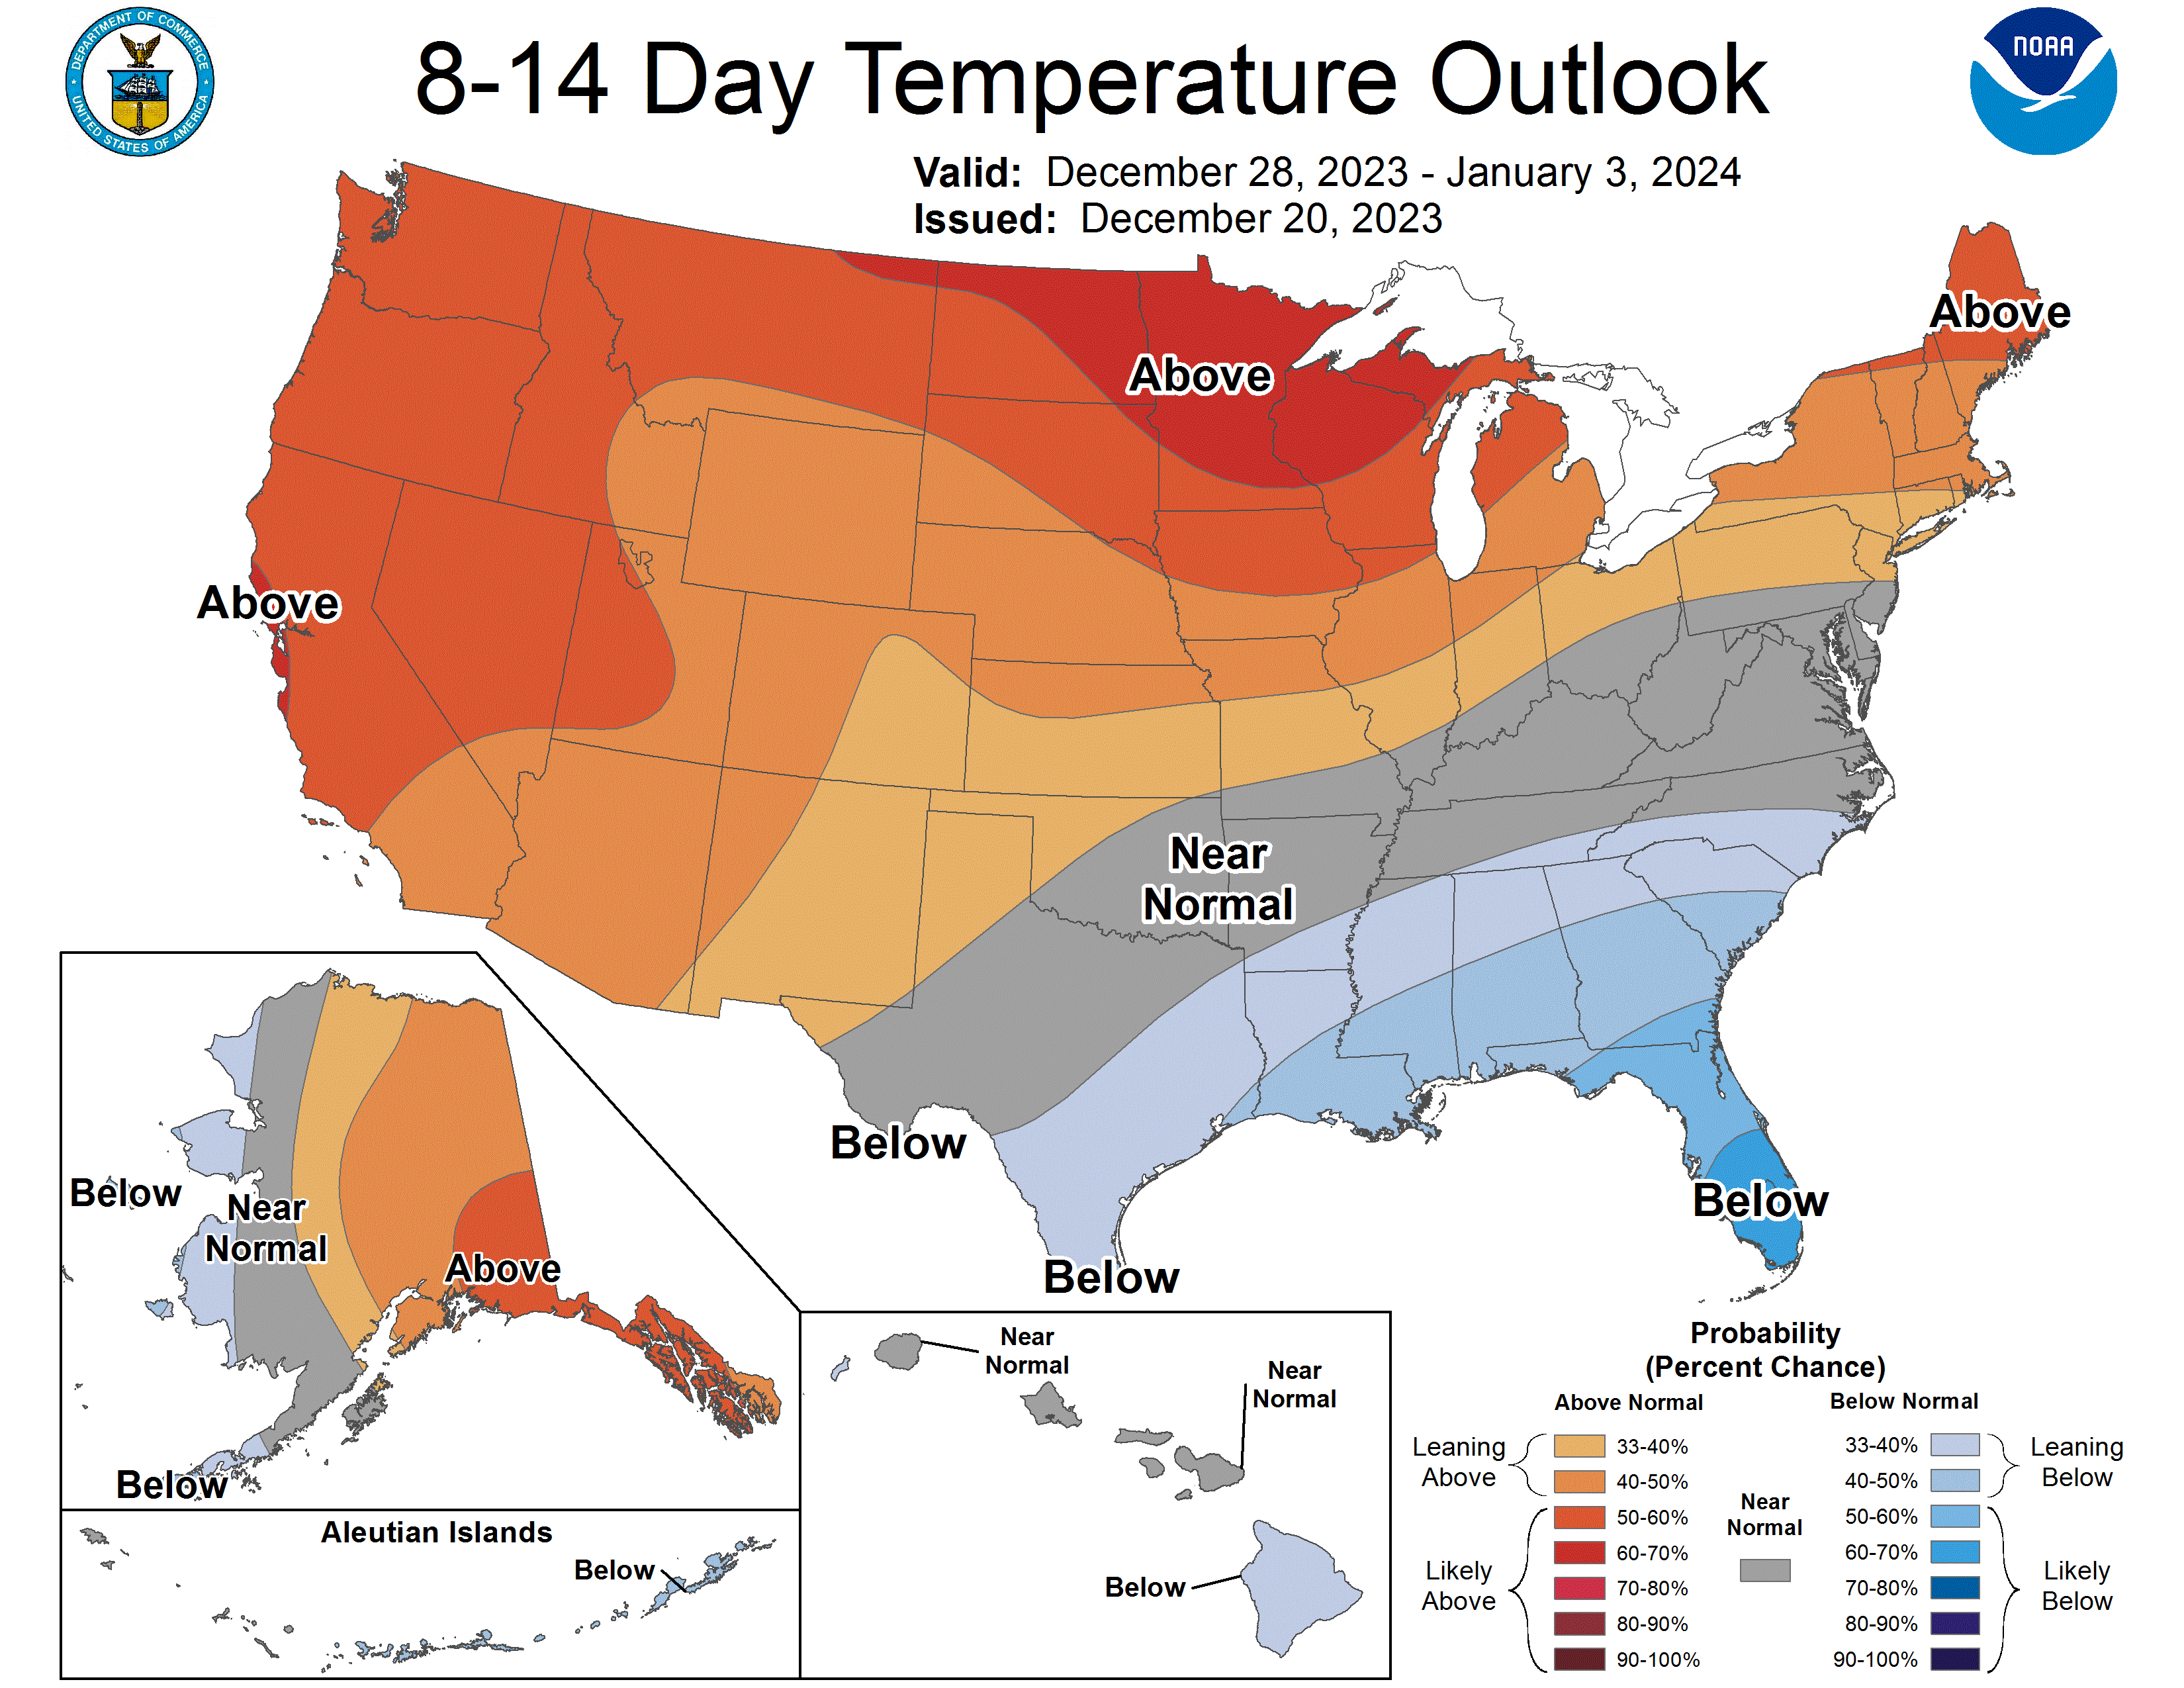
The CPC's 8-14 day forecast also calls for warmth for central and eastern Alaska around the New Year period.  It's a very typical El Niño pattern nationwide.


Thursday, December 14, 2023

Stormy Weather

The last few days have brought wild weather to large parts of Alaska, courtesy of a very powerful upper-level trough and associated low pressure system over the northern Gulf Coast.  Anchorage received measurable snow for 7 days in a row, with a total of almost 20", and that's enough to put them in first place for season-to-date snowfall at this point in the year.

Not surprisingly, the surface pressure analysis on Tuesday afternoon looked very similar to that from about a month ago, when Anchorage received its really big snow storm: the low center was a hundred miles or so to the southeast of the city.


Compare to the November 9 map posted here:

https://ak-wx.blogspot.com/2023/11/south-coast-snowstorm.html

The 500mb map from the same time on (this) Tuesday afternoon shows the mid-atmosphere trough in all its glory:


The eastward "tilt" of the trough at lower latitude is characteristic of particularly strong storm systems with a lot of upper-level "energy".  The sub-500 dm height at Anchorage (499dm to be precise) is notably low: about a third of winters in recent decades haven't seen a 500mb height that low all winter.

Here's an estimate of 3-day total liquid-equivalent precipitation, and the second map below indicates the estimated return frequency: over 5 years in parts of the higher terrain from the northern Panhandle up towards the Alaska Range.


The Fairbanks area received a significant snowfall, with a surprisingly large precipitation total of 0.54" (liquid equivalent) in the last 2 days (Tuesday and Wednesday).  I say "surprisingly" because temperatures were fairly low, only peaking at 10°F and 7°F on the two days respectively, and the snow:water ratio was an unusually low 11:1.  About 50% of winters in Fairbanks don't see a single 2-day precipitation event as large as this - although it has become more common in recent years.

Finally, the big pressure gradients associated with the broader circulation anomaly also generated big winds, especially for the West Coast, where the winds were northerly and created blizzard conditions.  Here are peak wind gusts (mph) for Monday and Tuesday.


Sadly the weather appears to have been a contributing factor in the deaths of two Nome residents on Sunday night:

https://www.adn.com/alaska-news/rural-alaska/2023/12/13/missing-nome-snowmachiners-found-dead-troopers-say/


Friday, December 8, 2023

Warm November and El Niño

With climate data now available for November, it's time to review the obvious: it was a very warm month for most of Alaska compared to long-term normals, and it was especially mild in northern Alaska.  Statewide, the average temperature was the 4th highest on record, trailing 2002 (the warmest), 1979, and 1952.


According to the NCEI climate division data, the North Slope saw its 2nd warmest November since 1925, with only 1979 having been slightly warmer.

Model-estimated and (sparsely-observed) grouth-truth measurements of precipitation are broadly in agreement that the month was generally wetter than normal except near the West Coast and in southwestern Alaska.  Anchorage saw an amazing snow onslaught in the middle of the month that led to a new record for November snowfall (39.3") and liquid-equivalent precipitation (3.44").


Rick Thoman's post over at Substack provides much more detail:


Perhaps surprisingly, the monthly mean mid-atmosphere pressure pattern doesn't show particularly amplified anomalies; we might have expected a stronger Bering Sea trough and western Canada ridge, for example, to have produced such pronounced warmth.


However, the weak ridge over British Columbia and the trough over far eastern Russia did create more southwesterly flow than normal, and there is very widespread unusual warmth in the surface waters of the North Pacific (see below).  Given this kind of ocean warmth, the odds are stacked heavily in favor of warm weather in downstream locations.


It's interesting to look at what happened in past winters that had a very mild November in Alaska.  Here's the December-February temperature analysis for the top 8 such years since 1950:


The big warm patch in the central tropical Pacific signals the presence of El Niño, which lines up with current conditions: we are currently in a robust El Niño - see the large and pronounced equatorial warm tongue in the November SST map above.  A warm November is more often than not followed by a warmer than average winter in interior and eastern Alaska, which is also consistent with the typical El Niño outcome.  The small sample of warm Novembers also suggests that below-normal temperatures may be slightly favored for Alaska's West Coast, but I wouldn't take that seriously with so much warmth in the North Pacific and Bering Sea this year.

Here's the average 500mb height (pressure) anomaly in the 8 years with very warm Novembers.  This indicates a trough with low pressure near southwestern Alaska, a very typical setup for El Niño.


In light of this, today's forecast for the days leading up to Christmas is absolutely classic: the GEFS ensemble mean shows a powerful trough over the Aleutians and a very intense North Pacific jet stream - see below.  It's rare to see ensemble-mean signals this strong nearly two weeks ahead of time, and as long as El Niño has this kind of grip on the pattern, it will be tough to get sustained or significant cold in Alaska.


Saturday, December 2, 2023

Hythergraphs

A couple of days ago, Amanda Young of UAF's Toolik Field Station posted a link to a new tool for visualizing climate data since 1988 at Toolik:

The temperature data is incomplete prior to 1994, and unfortunately precipitation coverage is rather poor until the last few years, but nevertheless the presentation is worthwhile.  It's interesting to note that 2021 was the coldest year since 1999 at Toolik; this is a more significant cold anomaly than I had realized.  Both NOAA/NCEI and ERA5 indicate that 2021's average temperature fell at approximately the 25th percentile compared to the 1991-2020 climate on the north side of the Brooks Range, i.e. not as cold relative to "normal".


The Toolik website also presents hythergraph climate summaries.  This is a visual presentation that I hadn't come across before, although it seems it's been around for more than a century.  I decided to try my hand at the hythergraph, so here's one to illustrate the statewide monthly climate averages, per NOAA/NCEI data:


The chart has several attractive features.  It nicely summarizes the similarity or contrast between different months, with the "vector difference" on the chart showing the difference in this two-dimensional temperature/precipitation phase space.  For example, November is a lot more similar to December than it is to October, on a statewide basis.  The hythergraph also provides a nice synthesis of the combined annual cycles in temperature and precipitation, with the second half of the year being much wetter.

The comparison between the 1951-2010 and 2011-2022 trajectories also provides a useful quick look at how the last 12 years have compared to the earlier climate.  The striking difference has been the increased precipitation in August and September.  It's also notable that winters have been warmer recently.

A possible improvement on the diagram would be to include the typical year-to-year variability in each month, perhaps as a background shading.  This would reveal how significant the recent changes are compared to natural variability.

[Update December 4: Chris Swingley experimented with this idea, see his blog post here: https://swingley.dev/blog/p/2022/]

Here's one for Fairbanks:


The interesting shape is driven by the heavy concentration of precipitation in the warm season, skewing the top of the diagram to the right.  June through September have been notably wet in the last decade or so, but so have all of the cold season months except (presumably by chance) January.

Finally, Utqiaġvik, where the climate has changed so dramatically in the last 20 years or so.


The differences in September, October, and November are very striking; notice that October and November have become as wet as September and October used to be, respectively.  The much warmer and wetter climate of autumn and early winter is a response to much reduced sea ice, with open water providing not only a warming influence but also a lot of extra moisture.  In fact, every month of the year has been both warmer and wetter in the last 20 years.

I'm sure readers will observe other interesting aspects of this visualization; feel free to leave a comment.