Up through early September Alaska had considerably more days warmer than normal than cooler than normal in 2018, but periodic cool spells kept the run of warm days at a moderate length. Since early September though the index has been persistently quite high: by construction, index values above +3.3 fall into the "significantly above normal" tercile, and that has been the case every day since September 5th. This is an interesting situation in that the cause of the warmth has varied. For much of September and the first days of October, as Richard has noted here, strong high pressure aloft, first over the Bering and then a bit farther east from the Arctic to the Gulf of Alaska dominated. In the past week the pattern has transitioned to a "Gulf of Alaska" storm track pattern. In different parts of the state this weather pattern change has resulted in changing temperature regimes, but on the statewide scale, it's a nice example of how distinctly different patterns can lead to the same outcome: much above normal temperatures.

Exactly how the index is derived has gone through several iterations but here's the current version.
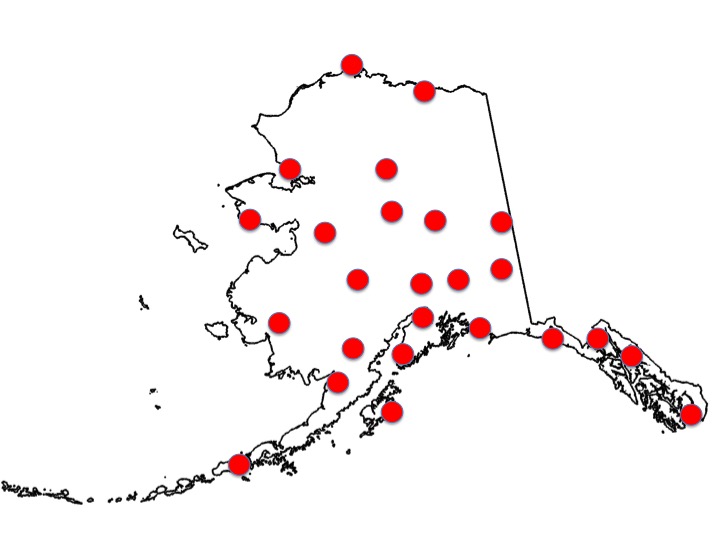
1) Find the standardized departure of the daily average temperature for each the 25 sites below (daily departure from normal divided by the standard deviation). This levels the playing field, so to speak, between inland areas, with much higher variability of temperatures, and marine dominated parts of the state, where water dampens the air temperature variability. These particular sites were chosen to be geographically representative as possible, the observations are all ASOS, so the climate day ends at the same time (midnight), the instrumentation is the same and all have NCEI published 1981-2010 normals (daily average temperature and daily standard deviation). The obvious gaps are the northeast Interior, inland North Slope and the Aleutians. In these regions there are no ASOS sites with published normals.
The next step is simply to find the mean of the 25 standardized departure. This is almost always a value ±1.5. The last step is to convert this "Alaska-wide average standardized departure" for the day into an index. To do this, we convert the daily average standardized departure into a Z-score. Doing this requires knowing the standard deviation of the "Alaska-wide average standardized departure". Now you might think that this should be 1. After all, by construction the 25 daily standardized departures have an a standard deviation of 1. However, because of the spatial correlation in daily departures, the standard deviation of the mean of the 25 sites is significantly less than 1: it turns out that it is about 0.71. The rest is simple: take the Z-score, which is a value between 0 and 1 and create the index. For simplicity, we wanted a "0 to 10" index, but after a little though, having zero be exactly average made it easier to understand. So the index goes from -10 to +10, with 0 being normal. Being derived from a Z-score, the index can never get to ±10, but it can get arbitrarily close: May 13 and May 14, 2016 had index values of +9.98, while January 27, 2012 the index value was -9.81.
Thanks Rick - this index is a great piece of work: simple yet very meaningful. It perfectly answers the question, "how unusual is the temperature" because it levels the playing field both geographically and seasonally. The only possible refinement I can think of would be to account for the skewness of the temperature distribution, which is significant in some places/seasons. Here are a couple of old posts on the subject:
ReplyDeletehttps://ak-wx.blogspot.com/2014/03/skewed-winter-temperatures.html
https://ak-wx.blogspot.com/2014/03/temperature-skewness-maps.html
One other comment, I suppose the argument could be made that absolute departures from normal are more meaningful than standardized departures for physical systems and perhaps for biological systems as well. (Although I imagine that biological ecosystems respond to and reflect the typical climatic variance as well as simply climatic averages - e.g. first/last freeze dates. In other words +5F may well be more biologically significant in Juneau than in Fairbanks.) But in any case, a parallel index using absolute anomalies would also be valuable for some applications. Of course most of the variability would occur in the cold season and would be dominated by the interior and north of the state.