Wind chill has been a concern across much of interior and northern Alaska in recent days, with a notable combination of wind and cold in many locations. The more exposed locations of course had the worst of it; Eagle Summit saw a wind chill of -66°F on Thursday morning (-30°F temperature with 28mph wind), and Brooks Range passes have been very cold in the past couple of days. The Arctic coast has had several rounds of strong winds in the past week, but residual warmth from the ocean kept temperatures a little higher, at around -10°F or so.
As usual, the "winner" in the wind chill department is Howard Pass, with a wind chill down to -71°F yesterday evening.
This latest episode of extreme weather at Howard Pass, and comments from reader Gary on last week's post, led me to do a comparison of wind and temperature data from relatively nearby stations in the western Brooks Range. The results illustrate nicely the unique and highly localized winter climate of the Howard Pass site. Here's the location we're talking about, for those who may not be familiar (click to enlarge);
First, the chart below shows the joint distribution of daily mean temperature and wind speed at Howard Pass in the winter months. There's a huge amount of missing data, because the instrumentation often fails to make it through the winter owing to the harsh conditions; the last reasonably complete winter of data was 2016-2017. Nevertheless, there's plenty of evidence to show the remarkable inverse correlation of temperature and wind in winter: the lowest temperatures always come with wind, and high winds almost always bring serious cold. This is because cold air from the North Slope is funneled up and through the pass from a NNE direction, as in today's observations above. The strongest pressure gradient across the Brooks Range tends to accompany the coldest conditions on the North Slope, so this is a recipe for extreme wind chills at favored pass locations.
The same chart for the Imelyak RAWS, about 40 miles to the south and 1500 feet higher in elevation, is completely different:
The absence of cold, let alone cold plus wind, is quite remarkable at Imelyak; with nearly complete data since summer 2012, the lowest minimum temperature recorded is only -37°F.
Here's the joint distribution of winter wind chill for these two sites. Here I've calculated wind chill from the daily mean temperature and wind speed, rather than starting from hourly data, so it's not a true daily mean wind chill (because the formula is non-linear).
A histogram format shows another view of the same thing: Howard Pass completely dominates on the low wind chill side of the distribution, even though Imelyak is 1500 feet higher in elevation.
Another relatively nearby observing site is the top-quality Ivotuk CRN installation, about 37 miles to the northeast of Howard Pass as the crow files. Despite a similar elevation, Ivotuk has a wind-temperature relationship that looks much more like the interior North Slope: not much wind, and when it does get breezy, it's almost always warm. The contrast from Howard Pass is really striking.
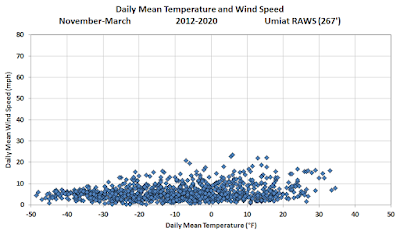
Here's a chart from the classic interior North Slope site: Umiat, another 100+ miles to the northeast.
Note that winter temperatures are highly correlated between Ivotuk and Howard Pass; they usually experience the same air mass, but the wind speed behavior is opposite. (The coldest days at Howard Pass are missing on this chart because Ivotuk didn't start reporting until 2014.)
In summary - this is simply more documentation of the unique and fascinating local winter climate at Howard Pass. As always, thanks to Ken Hill and Pam Sousanes (and probably others) for their persistent efforts over the years to maintain the Howard Pass site.


Thank you Richard for this look at Howard Pass. I got somewhat cross threaded thinking about winds and temps aloft versus advected cold at the surface. With no Skew-T available for the Brooks Range (I assume) knowing upper air temps would have to come from aircraft pilot reports overhead versus nearby surface obs stations.
ReplyDeleteSo in lieu of that data I'm backing off of my assumption that cold can also regularly come from air above mixed by flow and terrain features towards the surface. It's more likely advection that makes Howard Pass quite the chiller.
From recently reading Ernest Burch's trilogy about the Inupiaq, they occupied the Noatak River lakes and rivers nearby in winter (but likely not directly in the big chill area) and used any Caribou killed by freezing during extreme windchill events as a food source.
Gary
Thanks Gary. One could look at temperatures aloft in reanalysis data, but yes - advection seems to be the key contributor here. I believe it's a true funneling effect, because the flow is constrained both horizontally (by terrain) and vertically (by temperature inversion) when the cross-barrier pressure gradient sets up. Bernoulli effect, or something like that.
DeleteGo here to visualize via Windy the Howard Pass WX via the ECMWF model: https://www.windy.com/68.150/-156.900?67.916,-156.900,8,m:fyKaNF
ReplyDeleteScroll the elevation widget to the lower right to get some idea of estimated winds aloft.
Gary
That is a really impressive visualization. Thanks for the link.
Delete