Tuesday, July 27, 2021

Heavy Rain

I'm on the road and unable to do justice to the story at present, but heavy rain in western and interior Alaska is the big headline this week.

First, the east-central interior from the Alaska Range to the White Mountains saw a very notable episode of heavy rain on Friday evening and early Saturday; here are rain totals courtesy of the NWS:


Most of this fell in little over 12 hours.  Here's a map sent by Rick Thoman for Fairbanks-land:


Following hot on the heels of this event, a big rain is unfolding for the Seward Pensinsula and northwestern Alaska, with forecasts suggesting multi-day totals that could break longstanding records:


It's only been a few weeks since we were talking about heavy rain in the northwest, so this will add to the already substantial seasonal anomaly.

Here are the NWS estimates of total rainfall over the past several days:


Wednesday, July 21, 2021

North Slope Thunderstorms

The last couple of days have seen some remarkable thunderstorm activity in western and far northern Alaska.  Here are maps of lightning strikes from Monday and Tuesday, courtesy of the AICC:


July 19:

July 20:

On Monday, the 1500 lightning strikes west of 160°W (the longitude of Selawik) was the 5th highest for a single day in the 2012-present history of the lightning network in its present form.

But yesterday's action was relatively much more impressive, with more than 850 strikes north of 70°N; this is the highest daily total north of 70°N in the Alaska sector, by a multiple of well over 3.  The previous record was only 240 strikes, on June 20, 2013.  However, it's worth noting that the same day - and the next - in 2013 saw much more lightning farther inland on the North Slope.

A nice view of an approaching thunderstorm and its dramatic passage yesterday was provided by the FAA weather cameras at Atqasuk, just 60 miles inland from Utqiaġvik.  Some of the scenes looked like something from the U.S. midwestern states - for example check out this shelf cloud:


A very interesting roll cloud developed along the edge of the cold outflow as the storm moved over:


Here are some simple animations from 3 different angles:


Saturday, July 17, 2021

Climate Monitoring

One of the exciting aspects of modern climate science is that the tools for monitoring global climate have advanced by leaps and bounds in recent years.  Regular readers know that I'm a fan of the ECMWF's ERA5 reanalysis, which is a global gridded model estimate of hourly weather across the globe, and extending back to 1950.  The ERA5 product even includes uncertainty information based on an ensemble of possibilities that are consistent with the observed historical data.  ERA5 is certainly not without flaws, some of which are obviously connected to the 31-km grid spacing, but for many purposes it is a tremendous tool.

To illustrate what ERA5 can deliver, here's a look at June climate anomalies for a few variables that we don't usually monitor in detail, because they are not widely measured at ground level with consistent and reliable instrumentation.  For example, solar radiation:


The map shows the percentile rank of the June total solar (shortwave) radiation compared to the 1991-2020 distribution for the month of June.  On this scale, 0% would mean that June saw less solar radiation than any June in the past 30 years, and 100% would indicate it was the sunniest June in more than 30 years.  So according to ERA5, June was a very cloudy month along the west coast and western interior, as well as southwestern and south-central Alaska.

ERA5 precipitation shows a broadly similar pattern, with very wet conditions across the eastern Bering Sea, northwestern Alaska, and also in southeast Alaska.


Interestingly the NOAA/NCEI climate division data for June (see below) shows some significant differences, including much drier conditions from the Aleutians to south-central Alaska, but less dryness in the eastern interior.  Looking at some ground truth data, Anchorage was certainly dry with only 0.31" of rain (5th driest relative to the 30 years), and Homer also saw less rain than normal.  However, King Salmon was only a bit drier than normal, Kodiak was wetter than normal, and Cold Bay rainfall was substantially above normal (4th wettest).


We can also look at ERA5 wind speed, bearing in mind that presumably only the large-scale wind anomalies have much validity because of the model's inability to represent complex terrain.
 

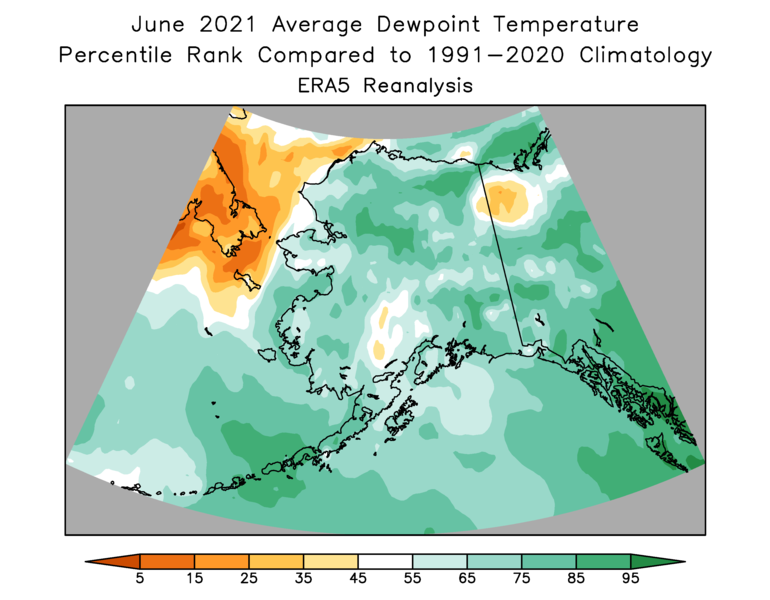
Here's dewpoint: above normal almost everywhere as a consequence of moist air being drawn up from the south.


The map below shows the mid-atmosphere pressure anomaly that produced the humid air flow and the wet, cloudy weather in the west and northwest: an unusually strong trough near the Bering Strait, and a strong ridge over southwestern Canada.  There was also very unusual low pressure in the Arctic, as highlighted in my comment a couple of weeks ago about the wet weather in the northwest.


Here's an example of an ERA5 variable that gives another perspective on the June climate anomalies:


According to the model, evaporation was well below normal in the southwest, but it was not widely suppressed elsewhere despite cloudy weather being quite widespread, and evaporation was higher than normal in the southeastern interior even though the dewpoint was high (because it was also warm - see figures at bottom).  But the far northern Yukon is a bit of a puzzle, as ERA5 shows below-normal evaporation despite low humidity and above-normal sunshine, wind, and temperature.  The surprisingly low evaporation may be related to low soil moisture, i.e. the the model thinks the ground was so dry that evaporation was reduced for lack of soil moisture.  The maps below show May and June soil moisture in the top layer of the ERA5 land model.


Finally, temperature - see below.  The ERA5 result compares reasonably well to the climate division data, except (and it's a big exception) on the North Slope.  Umiat was definitely warmer than normal, so this looks like a topic for further investigation.


Update: Rick Thoman's station plot for June showed near-universal warmth on the North Slope.  So I'm not sure what's going on with the climate division data, but I hope to find out.


Saturday, July 10, 2021

July Frost

Courtesy of Rick Thoman:


The 29°F at the Salcha RAWS is slightly impressive for the time of year: this has only happened twice in July in the past 15 years (27°F in 2012 and 29°F in 2018) - although last July had 30°F on 3 nights.

The chart below shows the hourly temperature trace, with the minimum occurring at 3am this morning and 1am yesterday (AKST).


Chicken also saw a freeze this morning: 31°F.  Early last summer I commented that Chicken hadn't seen a hard freeze (28°F or lower) in the height of summer for several years, but then it happened less than a month after my post last year: 27°F on July 3, 2020.

The Chalkyitsik RAWS (31°F yesterday and today) was also colder last July: 28°F on July 23.  None of these cold spots are reliably frost-free at any time of the year.

[Update July 11: 27°F this morning at the Salcha RAWS site.  To find colder than this in July, we have to go back to 2005, when 24°F occurred on July 21.  Also, Chicken saw 28°F this morning.]

Tuesday, July 6, 2021

Fire, Lightning, and Humidity

Following up on my June 26 post about surprisingly low fire acreage so far this season, I took up reader Gary's suggestion to look at humidity data from Fairbanks.  The idea is that higher humidity this year may have produced "wet" thunderstorms that deliver significant rainfall, rather than "dry" thunderstorms that more efficiently spark fires.

But first, a correction: I realized the chart I showed last time was incorrect, because I had some missing dates; so it turns out that cumulative lightning activity statewide this year has actually been lower than normal.  It was only about 25% below normal on June 20, but since then there has been little lightning despite some notable warmth.  Here's the corrected chart - my apologies:


This greatly reduces the mystery of low fire acreage this year, but nevertheless it's interesting to see that humidity was indeed higher than normal in June when we look above the surface to the 700mb pressure level (about 10,000') in the Fairbanks sounding data.  In the following chart, the red and purple lines show the 700mb relative humidity and dewpoint respectively, and both were well above normal in June.  Higher humidity aloft helps thunderstorms gain strength and produce more rainfall, because it reduces the "entrainment" of dry air that tends to mix away the moist updrafts.


Surface-level humidity, on the other hand, was somewhat below normal in comparison to recent decades.  Interestingly, there's little historical relationship between June fire acreage and humidity at the surface, perhaps because dry conditions mean fewer thunderstorms and fewer fire starts.  However, June fire acreage is clearly related to 700mb humidity; compare the two charts below.


In conclusion, low lightning activity is clearly a major reason for the low fire acreage so far this year (still well under 100,000 acres statewide), but above-normal humidity in the middle atmosphere may also have played a role by enhancing rainfall and minimizing so-called dry lightning.

Saturday, July 3, 2021

Big Rain in the Northwest

A lot of rain has fallen above the Arctic Circle in northwestern Alaska this week, courtesy of strong westerly flow circulating around a deep upper-level low to the north of Alaska.  The high-quality CRN site near the Red Dog mine (940' elevation) reported a remarkable 4.0 inches of rain in the last 3 days of June:


NWS estimates (see below) suggest that more than 6 inches may have fallen in some spots, but I'm not sure if any ground-truth measurements came in that high.  Here's one list that the NWS provided:


Regardless of the highest amounts, this was a very significant rain event over a large area, including the interior North Slope.  Click to enlarge:


The 500mb analysis from Tuesday afternoon (see below) shows the strong Arctic low, and notice the contrast with the extremely strong ridge over southwestern Canada.  All-time heat records were shattered in Oregon, Washington, and British Columbia, including an outrageous 121°F in southern BC on Tuesday (by far Canada's highest observed temperature of all time).  There was certainly a dynamical connection between the two features - the ridge and the Arctic trough - and the large amplitude of the overall flow anomaly helps explain the extreme rain outcome in northwestern Alaska.


Saturday, June 26, 2021

Low Fire Acreage So Far

The big story in the climate world this weekend is the outrageous heat wave currently affecting British Columbia and the Pacific Northwest of the lower 48 - and also far southeastern Alaska - but for today I'll highlight a bit of good news: Alaska fire acreage so far this season is surprisingly low.  As noted by Rick Thoman today, acres burned so far amount to only 60,000 - which is the lowest for the date since the exceptionally quiet year of 2008, when only 63,000 acres burned in the entire season.

Typically one-third of the season's fire acreage has accrued by this date, so it's becoming somewhat unlikely that we'll end up with an active season; there's a pretty good correlation between June 26 acreage and final acreage.  But let's not be hasty: fire activity can really take off in July, so the verdict isn't in yet.


I said the acreage is "surprisingly low" because lightning activity has been almost exactly normal so far, and temperatures have been above normal much of the time since spring, with a couple of notable warm spells this month (see below).  [Update July 6: this chart is not quite correct, see July 6 post for an update.]  It also hasn't been particularly wet, although my impression is that the thunderstorms that have occurred have been significant rain makers in localized areas.  So perhaps there has been less dry lightning than normal, and hence a reduced number of fire ignitions.


Monday, June 21, 2021

Arctic Temperature Trends

Following up on the topic of Arctic-wide temperatures (see this post from a couple of weeks ago), I've started working on some new graphics to visualize the ongoing ebb and flow of temperature anomalies across the 32 longstanding climate observing sites that I mentioned before.  But first, here's another view of monthly anomalies since 2010, but this time presented in terms of standard deviations; so this puts all seasons on a level playing field and eliminates the spike in temperature variance during winter.


The message is the same: Arctic-wide temperatures saw a jump up in winter 2015-16 and have remained generally elevated.  Since 2016, there have only been a handful of months in which any of the sites was 2 standard deviations below the 1991-2020 normal (last February at Bettles was one of them), but more often than not at least one site has been 2-3 standard deviations warmer than normal.  The community of Resolute in northern Canada saw a +3.5 SD anomaly in January last winter (it was the warmest January on record).

Here's a look at the 1980-2020 linear trend by calendar month, for the 32-site average temperature.  The absolute value of the trend is smallest in summer (a "mere" 0.4 °C/decade), but the statistical significance of the summer warming is on par with the rest of the year, and considerably exceeds the late winter minimum in significance.  All in all, the trend is most pronounced in late autumn, as we well know from discussing Utqiaġvik over the years (e.g. here).


Now on to a map view of monthly anomalies so far this year: below are pairs of maps for each month, showing departures from normal in both absolute and standardized terms.

January:


February:


March:


April:


May:


As noted in the previous post, February and March were slightly colder than (the 1991-2020) normal overall, but this was a mere blip in the context of the sustained warmth of recent years, as the top chart above shows.  Two Canadian sites - Resolute and Pond Inlet - had their warmest January on record, and the widespread warmth in Siberia in May echoed the persistent, excessive warmth of last year (see here for comments on 2020 in Siberia).

This month will also end up much warmer than normal in most of northern Siberia, because there's a major heat wave under way at present.  Here's a chart for Suhana at 118°E longitude, showing daily mean temperatures in the last 60 days as well as a forecast from today's ECMWF ensemble.  Temperatures are peaking at well over 10°C above normal for the time of year; today's high temperature was 32.7°C or 91°F.


For the 32 sites collectively, we see that temperatures have been running about 1-2°C above normal since late May.  The forecast suggests a respite towards the end of the month, with temperatures dropping back to near or just below normal Arctic-wide; we'll see if this pans out.