

As noted in the previous post, the forecasts are consistent with a strongly positive phase of the North Pacific Mode (NPM); here's a chart showing the NPM index values that the models are expecting.

We've seen in the past that the NPM phase is correlated with winter precipitation patterns across interior and northern Alaska, with above-normal snowfall often occurring when the NPM is positive. But what can we say about potential impacts for the next few months? Looking at Fairbanks first, the charts below show the historical relationship of the NPM index with May-July mean temperature and total precipitation.

We've seen in the past that the NPM phase is correlated with winter precipitation patterns across interior and northern Alaska, with above-normal snowfall often occurring when the NPM is positive. But what can we say about potential impacts for the next few months? Looking at Fairbanks first, the charts below show the historical relationship of the NPM index with May-July mean temperature and total precipitation.


Recent years have borne out the wide variation in summer rainfall amounts during a positive NPM phase, as 2013 was very dry (and extremely warm), but 2014 brought record summer rainfall. Both summers had a strongly positive NPM phase.
The map below shows the typical 500mb height pattern for positive NPM years when dry weather prevails in Fairbanks; not surprisingly the most common location for high pressure is over the eastern interior.

In contrast, years with a positive NPM phase but wet May-July weather in Fairbanks have the ridge axis located farther to the southwest, and importantly these years have an active trough over the Chukchi Sea; so this pattern favors strong westerly flow that brings wet frontal systems across the state.

From a North Pacific-wide perspective, the two patterns are rather similar, but the differences are crucial for rainfall in interior Alaska. The maps below show the precipitation patterns associated with the two sets of positive NPM years.

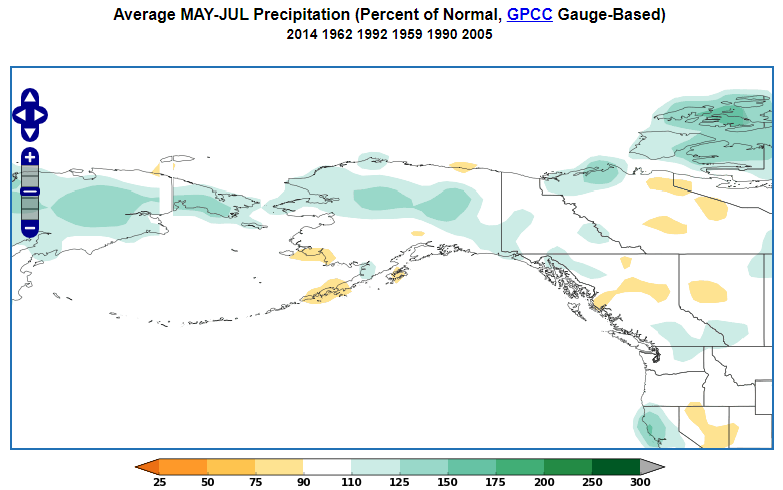
So which pattern should we pick to accompany this summer's expected North Pacific warmth? Well, the seasonal forecast models are clearly choosing the wet option, as a rather strong majority of the NMME ensemble members are showing significantly above-normal precipitation across western and northern Alaska.

The Climate Prediction Center is also going for wet, and the signal is a strong one for western Alaska; it's unusual to see 50+% probabilities of upper-tercile precipitation in the seasonal forecast.

There seems to be little reason to disagree with the strong model signal - it's usually unwise to do so - but just for fun I pulled up the May-July patterns that occurred in past years when Bering Sea ice was very low in the preceding winter (although nowhere near as low as this year): see below. The sea-level pressure pattern (top map) supports the idea of low pressure over the Arctic waters north of Alaska, but there's also a high pressure signal over most of the state, and interestingly these years were more dry than wet in the interior.


There's obviously more work that could be done to pick apart the varying ways that North Pacific SSTs interact with Alaska's climate at this time of year, but I expect we'll learn something just from watching the pattern unfold in the next few months. A wet summer seems more likely, but the historical NPM analysis suggests that it could go the other way - and so I think there is a bit more uncertainty about the forecast than the models and CPC would suggest.
ReplyDeletetoko viagra
viagra asli
pil biru
viagra jakarta