Showing posts with label River Ice. Show all posts

Friday, October 28, 2022

Rare Early Ice Jam?

Here's a puzzle for readers, concerning events on the middle Tanana River right now.  In what would be a very unusual event for the time of year, the Tanana River appears to have developed an ice jam yesterday near Fairbanks, causing the river gauge to register a rise of over 6 feet from yesterday morning to yesterday afternoon.  The water has been dropping only very gradually today.


The odd behavior is confirmed by this report via Twitter:


Water "flowing the wrong way" certainly suggests a jam.

My understanding is that it's very rare to see a genuine ice jam on a large river like the Tanana at freeze-up, because the ice is thin and easily dislodged; it's a totally different situation from spring ice jams.  However, with ice developing and increasing during freeze-up, a jam that develops at this time of year can be very persistent and even cause chronic flooding throughout the winter.  This may be a long-lived story.

Having said all that, though, there's a puzzle here: the Salcha River apparently had a very similar rise about 36 hours earlier.  If a single ice jam were the problem, and water were backing up, the rise would have occurred much later at the Salcha gauge, which is about 40 miles upstream from the Fairbanks gauge.  The Salcha-Fairbanks sequence looks more like a big volume of water is making its way downstream, although of course there may be more than one jam.
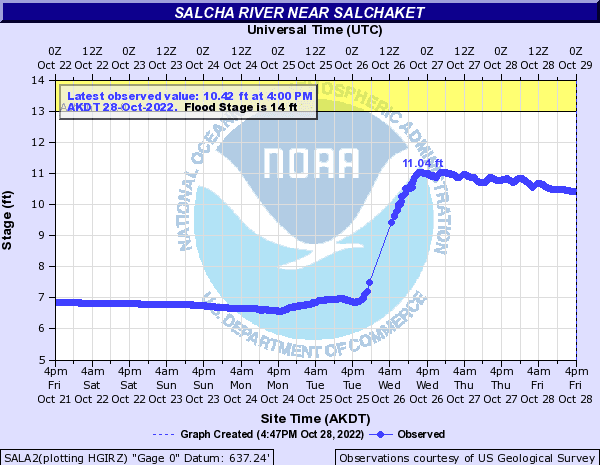

So which is it, ice jamming or a big new volume of water?  We should find out more sometime tonight, when we would expect a downstream-propagating rise to reach Nenana (another 40 miles downstream).  So far Nenana has seen a drop that aligns rather well with the rise upstream at Fairbanks, so this looks more consistent with the ice jam hypothesis (water held back and volume decreasing at Nenana).


I wonder if reader Gary wants to take a peek from his aircraft?  (Only joking, I imagine the NWS will bear that expense and solve the puzzle soon.)

Here's the evening scene at Nenana:

Update Saturday morning:

No rise overnight at Nenana, and a new observation: the Kuskokwim River at McGrath also saw a sudden and significant rise early yesterday.  It seems that ice jams are occurring widely during freeze-up this year.  But why?  Does anyone recall this happening in any previous year?

Update Sunday evening: another sudden rise, this one on the Koyukuk River at Hughes:


And another on the upper Susitna River.  Clearly this is what freeze-up looks like for interior Alaska this year.


Saturday, April 16, 2022

River Ice Wecams

For those interested in breakup progress, here's a nice resource for daily-updated webcam views:

http://fresheyesonice.org/view-data/realtime-data/river-ice-camera/

Yesterday's photos are linked below via Twitter.  There's no significant breakup yet; the ice is getting soft under the sun with warm afternoon temperatures, but nights have been cold.  Fairbanks has yet to see a daily mean temperature above freezing, and this is unusual: in the past 30 years, only 2013 and 2002 had zero thaw degree days by April 15.  Of course 2013 was the coldest April on record in Fairbanks, with a record late breakup at Nenana, and 2002 was also very chilly, with Nenana breakup on May 7.


Tuesday, October 15, 2019

Upper Tanana snowstorm

Following up on Rick's post yesterday, it's interesting to look at the analysis charts from last week's snowstorm in the upper Tanana valley.  Maps shown below are courtesy of Environment Canada's analysis page:

https://www.weather.gc.ca/analysis/index_e.html

The fundamental cause of the event was a very strong upper-level trough that migrated eastward and slightly southward from the central Bering Sea across southwestern Alaska to the northern Gulf of Alaska.  Below are 500mb maps from 3am AKST Thursday, 3pm Thursday, and 3am Friday; the "x" symbol marks the center of the upper-level low ("L").  Click to enlarge.


The system intensified considerably as it approached the Gulf of Alaska on Thursday, and a strong surface low pressure system quickly developed just to the south of the Alaska coastline on Thursday night, as illustrated by the surface charts from 3pm Thursday, 3am Friday, and 3pm Friday:


The north and northwest side of a strong low pressure system is a "good" place to be for heavy snowfall (in the Northern Hemisphere), assuming there is sufficient cold air in place; think of the coastal winter storms that occasionally affect the northeastern states of the Lower 48.  In this case, remarkably, the storm was able to produce a heavy band of snow on the interior side of the Alaska Range, i.e. in the upper Tanana River valley; this is a climatologically unfavorable area for heavy snow, because of the prevalence of dry downslope flow from the south - but this setup was very different from normal.

Rick highlighted the contrast in snow cover across the southern interior, and I too grabbed yesterday's beautiful satellite image to get a wider view.  The red dot marks the approximate location of Fairbanks (click to enlarge).


Particularly noteworthy to me are the obvious lack of Arctic sea ice - a remarkable sight for mid-October - and the still-unfrozen surface of North Slope lakes such as Teshekpuk Lake.  Here are a couple of yesterday's webcam views of Tesh Lake, showing just a little near-shore ice.  It would be interesting to take a look at observations of this summer's lake water temperature compared to previous years.


However, the situation has changed a bit today.


Freeze-up progress has been more substantial on Toolik Lake - recall it was still mostly open a week ago.


How about the rivers?  Ice was developing quickly in the Koyuk River at Norton Bay yesterday.


Some scattered ice is running in the Tanana River at Nenana today:


But as of yesterday the George Black ferry was still crossing the river at Dawson City in the Yukon:


Thursday, February 7, 2019

Dawson Ice Bridge Problems

Readers may recall that in the past couple of winters I've mentioned the odd reluctance of the Yukon River to freeze up properly at Dawson in the Yukon Territory.  This has created a problem for residents of West Dawson who in years past relied on an ice bridge for seasonal access to the main town on the east side of the river.

https://ak-wx.blogspot.com/2018/02/yukon-river-at-dawson.html

https://ak-wx.blogspot.com/2017/02/yukon-river-at-dawson.html

https://ak-wx.blogspot.com/2016/12/ice-cold-and-solstice-sun.html

Perhaps not surprisingly, the same problem has occurred this winter, and efforts to stimulate ice growth across the stubbornly open channel were called to a halt last week.  Here are a couple of news articles on this winter's lack of success:

https://www.cbc.ca/news/canada/north/gov-halts-dawson-city-ice-bridge-1.5001387

https://www.cbc.ca/news/canada/north/dawson-ice-bridge-hopes-1.4974031

Here's a view from the webcam in Dawson a few days ago, looking out across the river; as in past winters, a narrow strip of open water is visible.


The lack of an ice bridge has been deemed sufficiently important that Canada's National Research Council looked into the issue last year, and a report was issued in October; it makes for very interesting reading.  The report discusses a variety of hypotheses about what may have caused the change, but there are no definitive conclusions; there may be multiple factors at play, some of which we've speculated about before on this blog (including good comments from readers).

As we've noted before, the change in ice conditions can't simply be pinned on warmer winter weather, because temperature data from Dawson doesn't show substantially warmer conditions in the winters when freeze-up failed.  The accumulated total of freezing degree days has been slightly lower this winter than the two-decade normal, but 2016-17 and 2017-18 were both near normal through this point in the season (see below).  Of course it is possible that ground and/or river water temperatures have risen, as noted in the NRC report.


Friday, February 2, 2018

Yukon River at Dawson

Long-time readers may recall a few posts last winter that mentioned the exceptionally slow freeze-up of the Yukon River in Dawson (Yukon Territory).  It's interesting to note that the same thing has happened this winter - there is still a substantial gap of open water that has prevented the construction of the usual ice road to West Dawson.  This year an effort was launched to accelerate the freeze-up with a "slush cannon", but lack of progress led to the project being called off recently.

Here's how the river looked last Sunday.


Last winter we noted that an unusual ice jam upstream was the primary reason for the open water, rather than exceptionally warm weather.  It appears that the same may be true this year, because again the weather has not been particularly warm overall this winter in Dawson; the chart below shows that total freezing degree days through January 22 (when the ice-making project was canceled) were very close to the normal of the last 20 years.


The repetition of the slow freeze-up this winter suggests that it's not a random occurrence - "something" has changed - but the temperature data rules out a simple explanation based on excessive warmth.  I started to look for river flow data from the autumn to see if the river discharge has been unusually high or low, but I had difficulty acquiring suitable data.

One possibility (and this is mere speculation, being outside my field of knowledge) is that there could have been a subtle change in the river profile/cross-section upstream of Dawson, owing to deposition or erosion, that may have altered the hydrodynamics in a way that now favors the formation of an ice jam in a new location.  If any readers have comments on this idea, or other suggestions on how to identify the underlying cause of the open water (i.e. is it related to weather and climate), then I'd be glad to hear them.

Thursday, December 10, 2015

Late Freeze-Up

For some weeks now I've been checking the Nenana Ice Classic webcam every now and then to see if the Tanana River is finally frozen over.  Remarkably, it still isn't, as there remains a substantial width of open water that has been producing copious amounts of steam fog in the recent colder weather.  I'm not sure just how unusual it is to have open water this late - and of course the open patch may be less significant than it appears on the webcam - but nevertheless it seems notable.  Here's a shot from earlier today, with a temperature of -20°F at the nearby airport.


The late freeze-up is at least partially explained by the slow accumulation of freezing degree days so far this winter.  As seen in the chart below, the freezing degree days so far this season are barely above the level of the past two winters, which were notoriously mild.  There have been other years with lower FDDs through this date, but the only other time 3 such mild freeze-up seasons occurred back to back was in 1979-1981.


Slow freeze-up this year was also noted in a recent article here about ice fishing conditions near Kotzebue.  The article states that the timing of freeze-up was "once relatively consistent" but has "become sporadic over the past decade or so".  I thought it would be interesting to see if there's any evidence of this in the history of early winter freezing degree days in Kotzebue; the chart below shows the annual number of FDDs in September, October, and November.  Note that I show a data point only if 2 or less days are missing in the month, and for any missing days I fill in the values with normal temperatures to avoid a bias.


It's plain to see that the October FDDs have decreased rather substantially since 2002, and the November FDDs were also very low last year and this year.  We would therefore expect that freeze-up has become later in Kotzebue since 2002, but I'm not sure we can say anything about changing variability of freeze-up dates.  If anything I would guess that freeze-up has been more consistently late recently, whereas in earlier decades it appears that it was sometimes late and sometimes very early.  A more sophisticated freeze-up model using daily temperatures might reveal more about the nature of the changes.

One other point of interest on the chart is the warmer conditions that are evident in October in the early decades, particularly the 1940s and early 1950s; a very substantial cooling shift occurred in the mid-1950s, and the next 45 years were generally colder than the decades on either end.

Out of curiosity I also created the charts for Barrow and Fairbanks - see below.  The recent warming trend is very striking in all 3 months in Barrow, with the 10-year means dropping well below anything observed before; and here we can certainly say that interannual variability has decreased.  This year and last year brought slightly higher FDDs in October in Barrow (as we noted here), but there's still some way to go before Barrow might see a "normal" October.


The chart for Fairbanks shows relatively little change over the long-term, although the period since 2002 has been relatively mild on average, and the last three freeze-up seasons have certainly been delayed in comparison to normal.


Saturday, October 17, 2015

Yukon River at Eagle Ice Running

Richard noted in the previous post that ice was running down the Yukon River in Eagle. Is this typical? What drives the formation if ice in interior rivers?

Let’s deal with the questions in reverse order. Obviously you need below frezing temperatures for ice to form. But, it is not as simple as that. The drivers of river water temperature are very complicated. First, the top layer of water on a river needs to be at or slightly above freezing. This is largely driven by basin-wide characteristics of flow, air temperature, and the shortwave/longwave energy budget. The water flowing past Eagle mostly came from the Canadian Yukon Territory. There are nearly 1,100 river miles of the Yukon above Eagle and a basin area of 122,000 square miles. High flows mean greater stream velocities which delays freezup. High air temperatures also delay freezup. Especially cold temperatures early in the season have to overcome the still (relatively) strong solar radiation. All in all it is a complicated process. A nice summary of the processes is found in this document from UAF ( http://www.arlis.org/docs/vol2/hydropower/SUS102.pdf ). The document is more concerned with water temperature though.

For rivers like the Yukon, ice formation is initially dominated by the frazil ice process. Frazil ice is formed when supercooled water freezes on a condensation nuclei within the moving water. This generally happens when the low temperatures is in the lower 20s. As more and more frazil ice forms in the main channel, it clumps together – finally clumping enough to accumulate at river bends and to ultimately run across the width or the river.

The Cooperative observers in Eagle kindly made a notation of the first run of ice they saw for 22 different years between 1916 and 1960. During those years, the average first run date was October 18th. We should caution that a little bit of ice one year may be noted while another year required more substantial ice to warrant a notation. We will never know what the subjective criteria was. For this analysis, we assume they were consistent. Figures 1 and 2 show an example of notations made by the observer.


Figure 1. October 1920 Cooperative observer form for Eagle, Alaska.


 Figure 2. October 1947 Cooperative observer form for Eagle, Alaska.

Since frazil ice forms locally (i.e., doesn’t form in one spot and float for miles downstream), we expect that the formation is highly correlated to water temperature and air temperature. Unfortunately there are no good data sets for water temperature. Figure 3 shows the water temperature at Eagle in 2010. It’s the only data set that I found.


Figure 3. Water temperature for Yukon River at Eagle, Alaska. (from http://yukonriverpanel.com/salmon/wp-content/uploads/2011/04/ure-25n-10-yukon-temp-monitoring-on-yukon-trib.pdf )

Since we are then left with air temperature as the best proxy for ice formation, let’s see how well it correlates to freezing degree days. Figure 4 shows the ice run date for the 22 years that data is available (line) and the accumulated freezing degree days (bars). There really is very little correlation. Some years saw ice form with as little as 5-6 days of temperatures in the 20s. Other years saw 4-5 days in a row with temperatures dropping below zero before ice began forming. Figure 5 shows the relationship between accumulated freezing degree days (FDDs) and the date of ice running. Not much there.


Figure 4. First ice running date and accumulated freezing degree days for 22 years at Eagle as lines and bars.


Figure 5. First ice running date and accumulated freezing degree days for 22 years at Eagle as scatter plot.

Again, so much goes into the formation of ice. Is it clear or cloudy? Is it windy? Is the air dry or moist? Is new runoff entering the river? Is the flow fast or slow? Is it high or low? Lots to consider.

As a non–interior Alaskan, I welcome the opinions of those more knowledgeable on the subject than I am.

Friday, October 16, 2015

Snow Depth Graphic, Yukon Ice

Returning to the subject of the unusual September snowfall in Fairbanks this year, I created a different kind of graphic to illustrate the fate of all early autumn snowfall events in Fairbanks since 1930.  The chart below plots all non-zero snow depth observations from September 1 through October 15 in Fairbanks, with snow depth on the vertical axis and date on the horizontal axis.  Red markers indicate snow that subsequently melted out before the arrival of the permanent snowpack, and blue markers denote snow that stayed.  The "x" markers show the observations from 1992 and 2015.


A few features stand out on the chart.  First, this year's snowfall, despite being very unusual, was clearly much less anomalous than the 1992 event, which produced 10" on September 15.  Second, there have been other instances when 5-8" of snow in the first week of October melted out, so in retrospect it isn't too surprising that 11" on September 29 couldn't survive.  The 1992 event was accompanied by incredible cold that was arguably even more unusual than the snow.  Excluding 1992, there are hardly any blue markers prior to October 5, so it's very rare to see the permanent snowpack before that date.

The chart also illustrates that a snow depth above 4" after October 10 is very likely to survive; it's tough to melt snow in mid-October, even with sunshine and above-normal temperatures.  The downtown Fairbanks webcam shows traces of snow on the roof of the Yukon Quest HQ today, 10 days after the airport lost its snowpack, and after some unusually warm conditions.  The Goldstream Creek COOP near Fairbanks was still reporting 4" of snow on the ground as of yesterday morning.


On another note, there is now plenty of ice on the Yukon River at Tanana, as a result of some cold nights, particularly farther upstream; the Beaver RAWS was down to 2°F on Tuesday.  Here's a loop of the FAA webcam view in Tanana for most of the day today.


Update October 17: at least part of the Yukon is frozen over today at Beaver.


Monday, February 17, 2014

Chena River Ice Thickness

**  Update section added at the bottom of the post on 2/18 **

In two of the last three years I have traveled to Fairbanks in February or March. Whenever I go I always stay at Pike's Waterfront Lodge. One year the Chena River was open and the other year the thickness was only 5". However, upstream at the Steese Highway the thickness was quite healthy. This is apparently a common occurrence. But why?

The simple answer is that a power plant between the two sites puts warm, clear water into the River thereby reducing the ice downstream at Pike's Landing. However, the ice thickness is pretty close early in the season at the two sites. Also, Rick noted that another powerplant is upstream of the Steese Highway that generates power for Fort Wainwright. So, there is probably a simple answer but I don't know what it is. Thoughts?


Fig 1. Ice thickness measurements (dots) 2001 to present for Chena River at Pikes Landing and at Fairbanks (Steese Highway).

Fig 2. Smoothed ice thickness 2001 to present for Chena River at Pikes Landing and at Fairbanks (Steese Highway) using monthly averages.

Fig 3. Google Earth screenshot of the two measurement locations. The GVEA Aurora power plant is also shown.


Fig 4. Picture I took of a van stuck on the Chena River Ice Bridge in March 2012.


* Update section  *

Google Earth has a 'historical photography' utility that I just decided to check out. Fortunately there is some photography from March 9, 2009, that we can look at. The following four screenshots are ordered from east (Steese Highway) to west (Pike's Landing). The effect of the Aurora Plant is quite apparent. What is still unresolved is why the early season ice at Pike's is 'normal' but it deteriorates quickly in February. Presumably the power plant is in full production mode in December but the ice hasn't started to melt out yet. Perhaps the thermal 'front' takes a long time to make it down that distance from when the pkant operations kick into high gear earlier in the winter.

Fig 5. Google Earth historical image from March 9, 2009 (1 of 4).

Fig 6. Google Earth historical image from March 9, 2009 (2 of 4).

Fig 7. Google Earth historical image from March 9, 2009 (3 of 4).

Fig 8. Google Earth historical image from March 9, 2009 (4 of 4).