Wednesday, September 28, 2016

Seasonal Transition

Snowflakes arrived in Fairbanks yesterday morning for the first time this season, and the airport reported an hour of snowfall this morning before it changed over to rain; but there was no measurable accumulation.  It's a different story in the hills above Fairbanks, as evidenced by the webcam view from Cleary Summit on the Steese Highway about 20 miles out of town (elevation 2233').


Snow also accumulated for a while earlier today in more northerly parts of the interior, including Bettles and Allakaket.


Farther west, at Shungnak on the Kobuk River, the scene looked quite wintry - although much warmer air has moved in this afternoon.


Last year I created a chart to show the history of first and last dates for wintry weather phenomena in Fairbanks, and here's an update with a couple of tweaks (click for a larger version).


I ran a linear trend line through each of the 8 time series to see which of the long-term trends are statistically significant; here are the results with significance levels:

- First freeze date has become later (p<0.001)
- Last freeze date has become earlier (p<0.01)
- Establishment of winter snowpack has become earlier (p=0.03)
- Spring meltout has become earlier (p=0.04)

The first/last dates of measurable snow and of 0°F have not changed significantly over time.

The charts below show parallel results for Bettles and McGrath.  At Bettles, the only significant changes (over a shorter period of record) are that the first snowfall date has become earlier and the spring's last 0°F observation has become earlier.  It's interesting to note that the last 3 years have seen late freezes in Bettles in early summer, although meltout has been early.


At McGrath the only statistically significant change (surprisingly) is that meltout has become earlier over the 75-year period of record.


It's entertaining to look at the most extreme outlier dates for the 8 series shown on each chart, based on standardized departures from the mean.  For example, by far the most anomalous date at Fairbanks was the late arrival of the winter snowpack in 1934 - the year of the Brown Christmas.  The next most unusual date was the last 0°F measurement of spring 1964, which occurred when the temperature dropped to -1°F on May 9 - by far the latest sub-zero reading on record.  In 3rd place is the record late meltout (May 20) in 1937; this was related to the record 57" snow depth in February 1937.

For Bettles the single most unusual aspect of the data shown here is the record early snowfall of August 9, 1969 (2.6 inches).  This is not an observation error: it really happened; I should write about it some time.

The most anomalous event at McGrath was the mid-summer freeze of
2003: 31°F on July 17.  Other than this event, McGrath has never recorded 32°F or lower between June 7 and August 10.  Again, this was a real event, as temperatures were similar at nearby stations.

Saturday, September 24, 2016

Are Fairbanks Septembers Getting Snowier?

Rick T. here for a guest blog on Deep Cold. While we're still waiting for the first snow of the autumn in Fairbanks, Richard and I have been discussing whether there is evidence that Septembers are getting snowier. Below is the plot of September snowfall since 1920. The observation sites used for these data are the Ag Farm (now at UAF) 1920-29, Weather Bureau downtown (1930-1942), Fort Wainwright and Weeks Field (1943-1950) and Fairbanks International (1951-present). It's possible that observations prior the Weather Bureau becoming the "observer of record" are slightly low: cooperative observations generally measure less snow in the long run than Weather Bureau/Weather Service locations as cooperative observers typically make only one (two if we're lucky) snowfall measurements a day.

I've also plotted the 10-year running median snowfall. As you can see, the 10-year median has varied from a trace to 0.4". While five of the six Septembers with more than five inches of snow have occurred in the past 25 years, my impression is that there is no trend here, just random variation that includes a couple of big outliers. But of course, my impression is not evidence. Can we do some statistical work to help answer, in a more objective fashion, the question: do we have evidence that Septembers are getting snowier, or are 1992 , 1993 and 2015 just rare events that do not signal any large scale change in September snowfall?     
The first thing to notice is that we have 96 years of data. This seems like a lot, and it is a lot for climatological work in Alaska, but the presence of the two outliers is a big complicating factor. Notice that only two Septembers have had more than eight inches of snow, and both of those had more than twenty inches. The other complicating factor is that, unlike, say, temperature, snowfall has a natural lower limit of zero, and that exactly zero occurs with some frequency.

So, the question we want to investigate is: do recent September snowfalls mark a change in the "expected" values? That is, do we have evidence that, say, the normal is changing, or that the heavy snowfall Septembers are more likely now?

To start, here is a histogram of total September snowfall for all 96 years: note the bin sizes are not equal.

We can fit a variety of distributions to the observed values, but of the common distributions, a gamma provided the best fit. However, the gamma distribution is defined only for positive numbers, but since 18 percent of 1920-2015 Septembers having exactly zero snowfall, this seemed like a non-trivial limitation. So I opted for a tweedie distribution, which elegantly handles the exact zeros (and the gamma is a special case of the tweedie). So here's what I did:
  1. created a sample of 50 randomly selected values from the 96 September snowfalls that have actually been observed
  2. fit a tweedie distribution to the 50 "years" of data
  3. from the fitted tweedie distribution, constructed 50 years of simulated September snowfalls
  4. derived some statistics from the simulated half-century of data
  5. repeat 1000 times
  6. So, does this much larger (artificial) sample help us assess the recent increase in September snows?

Steps 1 and 3 are illustrated above. The histogram on the left is the outcome of 50 random selections from the September as actually observed: 44 years had 2.5" or less of snow, five years between 2.5" and 5", and one of the big outliers was picked up. From this we fit a tweedie distribution, and then draw 50 random values from the fitted distribution. The result is the histogram on the right. Unsurprisingly, it's a little more "spread out" and has a couple of high values (10.1" and 18.4"). We then repeat this 1000 times, keeping track of some information from each simulation (so that's 50,000 Septembers snowfalls we've simulated).

Since we're interested mostly in the high (snowy) end of the distribution, here's how maximum values in the 1000 simulations of 50-year September snowfalls shake out. The low values seem pretty realistic, but 16 percent of the simulations have maximum values higher than any observed in the real world (to date). It is kind of fun though to think about what it would take meteorologically to produce a 50" September snowfall in Fairbanks :)


So from this, my take is that the recent spate of higher September snows is, in fact, consistent with the historical distribution and that we have not seen anything other than the expected rare events, and that even much higher September snowfalls would be statistically consistent with the historical record.

So having said that, if you're still with me and have suggestions on improving this analysis I'd love to hear them. This work is the outcome of my working to learn to do statistical analysis and coding in R, and I (and Richard) thought Deep Cold readers might find this statistical noodling of some interest.

Technical note: in this analysis the observed September snowfall are summed from the daily values, and I have assigned small but none-zero values to days with "trace" snow. I've assigned that value to be low enough so that no number of days with trace values could sum to (with rounding) reach the lowest "measurable" amount (0.1").

Friday, September 23, 2016

Chinook Winds

The past few days have brought windy conditions to parts of southern and interior Alaska - to say the least.  Southerly downsloping winds gusted to hurricane force on Wednesday along the lower Delta River south of Delta Junction; the following map shows peak wind gusts (in mph) recorded by the dense observing network in the vicinity of Fort Greely.


At the Delta Junction airport, the sustained wind speed reached 53 mph, with gusts to 77 mph, early on Wednesday morning.  While Delta Junction is a very windy place, this is unusual even for there; in the era of ASOS measurements since 1998, only one wind event brought higher winds to the Delta Junction airport - on February 2, 2000, the sustained wind speed reached 58 mph.

The chart below shows the frequency of days on which the sustained wind speed exceeds 20, 30, and 40 mph at Delta Junction.  More than half of all days in December through February have sustained winds of at least 20 mph; this contrasts with a miniscule 0.9% of days in Fairbanks during the same season.  September is much less windy than the winter months in Delta Junction, but high winds do occur on occasion.


It's interesting to note that there are two preferred directions for high winds at Delta Junction: easterly and southerly.  Out of all the reports of 40+ mph winds (since 1998), two-thirds are from a 100° or 110° compass heading, and nearly all the rest are from 170-200°, i.e. nearly due south.  However, the strong easterly winds occur almost exclusively in winter, and this phenomenon is known as the Tanana Valley Jet - see here for more on that:

http://ak-wx.blogspot.com/2012/12/a-tanana-valley-jet-and-other-exicting.html

http://ak-wx.blogspot.com/2012/12/delta-differences.html

In the non-winter months, strong winds in Delta Junction usually come from the south in downslope fashion; and such was Wednesday's wind storm.

The chart below illustrates the directional dependence of strong winds by showing the 95th percentile of wind speed for each point on the compass.  For example, winds from the north are nearly always (95%) 10 knots or less, whereas southerly and east-southerly are the "windiest wind directions", so to speak.


Here's a 500mb height analysis for 4am AKDT on Wednesday, the same time as the highest wind speeds in Delta Junction.  The strong southerly flow over the Alaska Range was the culprit.


As the mid-tropospheric trough moved east over western Alaska over the next 36 hours, surface low pressure moved up from the Gulf of Alaska, intensifying as it moved inland and producing some very low pressure readings over the interior.  The sequence of analyses below, courtesy of Environment Canada, show that the central sea-level pressure was 975mb in the vicinity of Healy yesterday morning, and this is confirmed by MSLP readings of 975.1mb and 975.7mb respectively at Nenana airport and Fairbanks airport yesterday afternoon.  This is remarkably low for the time of year: in data going back to 1960, Fairbanks has observed MSLP this low only 3 times before in September (1966, 1997, and 1999).

4pm AKDT Wednesday:


4am AKDT Thursday:


4pm AKDT Thursday:


To round out the analysis, here's a map of observed high temperatures on Wednesday across the interior, showing warm conditions in the lee of the high terrain.  Interestingly the warmest report was a balmy 68°F at the Chalkyitsik RAWS far to the north.


Finally, here's a simple animation of webcam shots on Wednesday from a Delta Junction airport webcam, courtesy of the FAA; this camera looks northwest down the Tanana River valley.  Note the clouds of blowing dust moving from left (south) to right.


Tuesday, September 20, 2016

Cloud Cover and Temperature

With the changing of seasons in Alaska I often find myself pondering the nature of seasonal variations in atmospheric physics.  An example of this is the connection between cloudiness and temperature, which varies drastically through the year in interior Alaska.  We've seen previously that more abundant cloud cover is strongly associated with higher temperatures in winter and lower temperatures in summer in Fairbanks, owing to the effects of clouds on the net radiation gain or loss at the surface.  But what is the "breakeven" date for the effect of cloud cover on temperature?  In other words, at what date in the autumn does the climate transition from clouds having a net cooling effect to clouds bringing relative warmth?

The chart below helps answer this question; it shows the correlation of cloud cover with temperature by date, calculated over 31-day running windows of dates through the year.  Note that I sorted the cloud cover amounts and used the rank of cloud cover rather than the actual cloud cover values, to help reduce complications with the skewed and bounded distribution of cloud cover.


The results show that cloud cover is positively correlated with daily mean temperatures from October 2 to April 20, or more than half the year.  However, there is a strong contrast between the response of daily minimum and maximum temperatures, as we would expect: enhanced cloud cover reduces daytime high temperatures from April 6 to October 22, but daily low temperatures are nearly always warmer when it's cloudy.

The most interesting aspect of the results may be the absence of correlation for daily minimum temperatures at the very peak of summer in Fairbanks: for the 31-day period centered on July 5, there is actually a tiny negative correlation between cloud cover and low temperatures.  This is illustrated in the scatter plot below.  Remarkably, this means that clear conditions are no cooler than cloudy conditions during the "nighttime" hours of high summer.  As I understand it, this curiosity arises because the nights are too short for longwave radiation processes to become dominant over the shortwave radiation influence of the day.  At any other time of the year, the sun goes away for long enough to allow surface temperatures to respond to the cloud-modulated longwave radiation from above; but in high summer the minimum temperatures are just as much influenced by how much solar heating there was during the previous day.


While I was at it, and for future reference, I also created a similar correlation chart for 850mb temperatures - see below.  Daily high temperatures are more closely connected to conditions aloft than daily low temperatures for most of the year, as solar heating allows air from aloft to mix down to the surface by day.  However, this process is largely inoperative during the darkest period of the winter.


Saturday, September 17, 2016

Humidity Trends Aloft

At various times on this blog we've discussed the long-term increase in summer daily minimum temperatures in Fairbanks, for example in these posts:

http://ak-wx.blogspot.com/2013/08/climatology-of-warm-summer-nights.html
http://ak-wx.blogspot.com/2016/08/warm-nights.html

The trend towards later first freeze dates at the airport has also been a repeated topic of discussion (just search for "first freeze").  Spurred by a comment from reader Gary, I thought it would useful to look again at summer humidity trends as a possible part of the explanation.  Back in July I looked at dewpoint measurements at the airport and showed that humidity has increased at the surface in June and July.  But what about aloft?  The chart below shows the monthly linear (least-squares regression) trends for temperature and dewpoint at 850mb, using only the 3am balloon soundings as I'm interested in overnight minimum temperatures.  I began the analysis in 1958 because prior to the International Geophysical Year the soundings were released at 6am, and I wanted to keep the observation time consistent; and also I'm a little less confident of the early humidity sensors.


An interesting aspect of this chart is the absence of warming in November followed by the pronounced warming trend in December, but that's a topic for another day.  The humidity trends reveal an increase in dewpoint above Fairbanks throughout the warm season, and this is consistent with higher minimum temperatures regardless of the temperature trends.  Water vapor is a highly effective absorber and emitter of longwave infrared radiation, so increased humidity leads to greater downward radiation and therefore reduces the rate of net energy loss when the sun is low in the sky or below the horizon.  Anyone who has experienced high humidity in the tropics can attest to this effect: when humidity is very high, the surface temperature may drop only a few degrees on a perfectly clear and calm night over land, because the surface is bathed in infrared radiation from aloft throughout the night.

It's also interesting to see that the dewpoint trend is higher than the temperature trend in June through September, and especially in July and August, and this means that the relative humidity has increased over time; see the chart below.  All else being equal, one would expect higher relative humidity to correspond to greater cloudiness, and of course the presence of clouds is a strong warming influence on daily minimum temperatures.


The chart below shows the contrasting trends in 850mb relative humidity in February and August.  Note that the drying trend in February isn't related to decreasing dewpoint but rather to increasing temperatures, as shown in the first chart above.  Also I'd caution that these trends have been observed over a relatively short period - we know that there were major climate anomalies in the 1930s in Alaska, for instance, so the trends would no doubt look different if we had good upper-air data from earlier years.


Finally it's interesting to take a quick look at the relationship of 850mb dewpoint to the date of first freeze in Fairbanks.  By trial and error I found that the mean dewpoint in the period August 27 - September 8 is most closely related to the first freeze date, with a modest correlation - see the chart below.  Interestingly the correlation is slightly lower for temperature at 850mb; the dewpoint aloft explains a bit more of the variance in freeze dates than the temperature aloft.  As we would expect, when it's dry aloft, frost tends to come early, but when it's humid, the first freeze is delayed.


Tuesday, September 13, 2016

Snow on the Yukon

A quick update to record the occurrence of some light snow cover this morning on the banks of the Yukon River at Beaver, elevation 340', 105 miles north of Fairbanks.  It was gone by noon as the temperature rose into the mid 30s.

The season is quickly advancing.


Update September 14: Bettles and Coldfoot got in on the action this morning, with some light accumulating snow.


Surface ice cover is evident today on some smaller freshwater lakes on the North Slope, for example near Teshekpuk Lake:


Monday, September 12, 2016

Cold Nights at Beaver Creek

The first freeze of the season occurred at Fairbanks airport on Thursday morning (September 8), and Saturday also saw freezing conditions.  This is nothing unusual compared to the long-term climatology, of course, but it's on the early side of what has been observed in the past couple of decades.  Four of the last five years have now had a freeze by September 10 at the normally warmer airport location.

Other locations in the interior have been much colder; the Goldstream valley observers reported 21°F, the Salcha RAWS measured 17°F, and a very chilly 12°F was reported from the Chalkyitsik RAWS on September 7 and 8.  The Chalkyitsik RAWS is located on the Yukon Flats about 25 miles east of Fort Yukon, half way between Fort Yukon and the village of Chalkyitsik itself.  Looking at the historical data from the site, there's no particular reason to doubt that it really got this cold last week; back in early September of 2004, when a long sequence of cold nights occurred across the interior, the Chalkyitsik RAWS dropped into the single digits Fahrenheit on 5 consecutive nights from September 6-10.  The chart below compares the hourly temperatures in the September 3-10 period from 2004 and this year.


These remarkably chilly conditions at the Chalkyitsik RAWS led me to look more broadly at data from this site and also from the similarly-placed automated observing site near Beaver.  The Beaver RAWS is located on Beaver Creek about half way between Beaver (on the Yukon River) and Birch Creek to the east.  Both the Beaver RAWS and the Chalkyitsik RAWS lie within the broad low-lying region of the Yukon Flats, and both sites are very cold in winter.  The Beaver RAWS site is slightly colder - and in fact based on NOAA's GHCN data, the Beaver RAWS has the lowest (year-round) average daily minimum temperature of any site in Alaska outside the North Slope.

The chart below shows the monthly means of daily minimum temperature at the Beaver RAWS and at Chicken, the latter being a notorious pole of cold.  The calculations are performed only for days with observed (not missing) data at both locations in the common period of record.  Chicken, being at an elevation of 1800', has colder nights in summer, but Beaver Creek is colder in November, March, and April.  The overall difference is only a tenth of a degree Fahrenheit and thus not significant, but nevertheless the Beaver RAWS tops the list for "nighttime" (daily minimum) cold in interior Alaska.  Note that I haven't analyzed daily maximum or daily mean temperatures, because RAWS sites are known to have a warm bias on sunny days with light winds, owing to inadequate ventilation of the thermometer.


The most striking aspect of the Beaver Creek cold may be the very rapid drop in minimum temperatures in late summer and early autumn, before snow is typically on the ground.  From July to September, the average daily low temperature drops more rapidly at the Beaver RAWS than any other site in Alaska (including the North Slope).  Other locations, mostly at higher elevation, are colder than Beaver Creek in September, but none sees the same rapid onset of cold nights as summer wanes.

For example, consider that the Beaver RAWS has seen temperatures in the teens Fahrenheit in 6 of 26 Augusts with complete data, including 13°F in August 1996 and 16°F in August 2013; the average August brings at least one night with a low of 22°F.  And yet, a hard freeze is unusual in July, as only 30% of years reach 32°F in July; the Goldstream valley of Fairbanks does better than that.

Readers can follow the hourly data from the Chalkyitsik and Beaver RAWS at:

http://mesowest.utah.edu/cgi-bin/droman/meso_base_dyn.cgi?stn=cika2&unit=0&timetype=LOCAL

http://mesowest.utah.edu/cgi-bin/droman/meso_base_dyn.cgi?stn=wbqa2&unit=0&timetype=LOCAL

Thursday, September 8, 2016

Fire Season Review

With distinctly autumnal weather now occurring in parts of the state, it seems like a good time to look back at the 2016 fire season.  Extremely warm conditions last winter and spring raised concerns about fire activity in the early part of the season, but the June 1 wildfire outlook called for normal fire potential for the summer months, and this turned out to be a good forecast.  The total acreage burned as of today is just slightly under half a million acres, which is about 25% below the 1996-2015 median.  Compared to last year's extreme fire season, it's been a very benign year.


The only period of really significant fire activity this summer was triggered by the mid-July heat wave.  In the week ending July 21, nearly 300,000 acres burned, or well over half the season's total; but this is not unusual.  The 1996-2015 median for peak 1-week fire acreage is 324,000 acres, so it is typical to see at least one week of bad fire conditions at some point in the summer (but usually before the middle of July).

The chart below compares this year's monthly fire acreage to the historical distribution; the pink columns show the historical range (minimum to maximum), and the black dashes show the median for each month.  Note the logarithmic vertical axis.  Only July saw above-median fire activity this year; all other months were quieter than normal owing to the wet conditions that prevailed over much of the interior for most of the summer.


Sunday, September 4, 2016

Cooler Nights at Last

Longer nights, clear skies, and lower humidity have finally allowed cooler nights to arrive in the Fairbanks area, including the first hard freezes of the season in the colder spots.  The first 32°F temperature showed up at the Goldstream Creek COOP on August 29, which is much later than usual.

Strictly speaking this is not the latest date for a reported first freeze in the Fairbanks area, but a straightforward historical comparison is not possible because there was no data in earlier years from the coldest spots like the Goldstream valley.  Based on the recent climate one might think this year's late freeze is unprecedented, but it is possible that some earlier years remained freeze-free around the area to an equally late date.  For example, in 1942 the 3 active observing sites didn't drop below 40°F until September 5, and the urban heat island was less significant back then.

One aspect that is definitely a record is that Fairbanks airport did not drop below 45°F until August 31 this year; the previous latest was August 28, in 2004.  The first freeze at the airport is probably still some days away, as the median date for this event has been September 15 in the last 20 years.  The chart below shows the date of the first 32°F temperature after July 15 for 3 stations around the area.


Wednesday, August 31, 2016

ENSO Update

It's been a while since we looked at the current phase of ENSO (the El Niño - Southern Oscillation), so let's do an update.  As I'm sure readers know, last winter's intense El Niño episode is long gone now, as equatorial Pacific sea surface temperatures dropped back to normal in the spring.  In the past couple of months temperatures have become modestly lower than normal in the central and eastern equatorial Pacific Ocean, so we're close to marginal La Niña conditions, but La Niña has not yet been declared.  Here's the latest weekly SST anomaly map, showing rather feeble cool anomalies along the equator.  Note the extraordinary warmth all around Alaska, a result (and a cause) of the exceptionally persistent warmth all year.


As last winter's El Niño event unfolded, there was much speculation that the next winter, i.e. 2016-2017, would be a La Niña winter, because a quick reversal into La Niña conditions has occurred before after El Niño; for example, this happened in 2009-2011 and in 1997-1999.  For a while the seasonal forecast models were showing this kind of scenario, with a significant La Niña developing this autumn, but the models have now backed off.  Compare the two charts below, the top taken from CFSv2 runs initialized in late April, and the bottom from the most recent runs.  The latest forecast shows the key Niño3.4 region getting no colder than at present, but actually warming as we go through winter.


The latest IRI/CPC forecast for ENSO still shows a greater chance of La Niña than ENSO-neutral conditions until late winter, but the outlook is quite different from a few months ago, when the chance of La Niña was believed to be above 75%.


So given that La Niña is on hold if not cancelled this winter, we'll be reverting to the PDO as a seasonal forecast tool for Alaska this winter, correct?  Unfortunately, perhaps not - because the PDO index crashed about a month ago and near-neutral conditions have prevailed since then.


With near-neutral ENSO and PDO conditions at the present time, and ENSO-neutral looking like a reasonable bet for the coming months, we would not expect to be able to say much about what might unfold this winter in Alaska.  It is interesting to note, however, that Papineau (2001) showed results indicating that ENSO-neutral winters are warmer on average than El Niño winters from Barrow down the west coast to Cold Bay; the rest of the state tends to be cooler than during El Niño, but nowhere near as cold as during La Niña.  On this blog we've seen that the warmest January's in Fairbanks have tended to occur during near-neutral ENSO conditions; so it would not be a surprise to see warmth persist this winter, especially if surface temperatures don't cool off relative to normal in the Gulf of Alaska and Bering Sea.

The latest CPC forecast for December-February expects neither warm nor cold conditions, relative to normal, over the southern half of the state, and they also show equal chances for precipitation over the interior.  Recall that this doesn't mean CPC is forecasting near-normal; they just don't feel able to make a call one way or the other.  Hopefully a clearer picture of likely anomalies will emerge in the coming months.


Friday, August 26, 2016

Wet in the Northwest

Parts of northwestern Alaska have seen very heavy rainfall in the past week or so, as very moist southwesterly flow has been drawn up into the western Brooks range.  The highest rain totals were observed at the high-quality CRN site near the Red Dog mine, about 30 miles north of Noatak and 45 miles northeast of Kivalina.  The CRN instruments sit at an elevation of 942 feet above sea level with higher terrain to the north and northeast, so flow from the south or southwest is favorable for heavy precipitation.  The station reported 4.97" in 3 days ending on the 20th, with 2.89" on the 19th alone.

Heavy rainfall continued in the subsequent days at points farther to the east in the western Brooks Range; the following images show the NWS estimates of precipitation over several consecutive days (with one image missing for the 23rd - sorry):


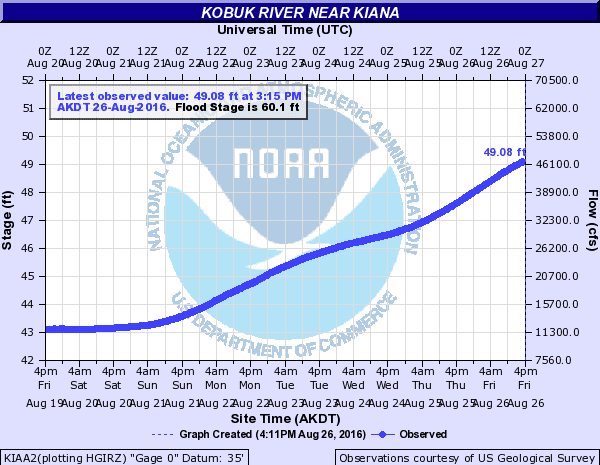
It's no surprise to see the NWS issue an advisory today for high water levels on rivers in the area.  As noted by the NWS, the flow of the Kobuk River near Kiana has more than quadrupled in the past week:


Here are a couple of soundings from Kotzebue that show the strong southwesterly low-level flow around the time of the very heavy rainfall at Red Dog.  The sounding at 4pm AKDT last Friday reported 45 knot winds from the southwest at 3000 feet above sea level, transporting copious moisture into the hills to the north.


As remarkable as 5" of rain in 3 days seems at a latitude of 68°N, it's apparently not that unusual for the Red Dog CRN site, which has been in operation for exactly 6 years today.  The chart below shows the monthly precipitation totals (liquid equivalent), and we see that not only was last August also very wet, but August 2012 produced an extremely large amount of rain at the site.  Given that August 2012 was also by far the wettest month on record at nearby Kivalina, with a remarkable 8.8" of rain, the extreme Red Dog total is plausible.


It is no coincidence that August 2012 also produced the strong Arctic cyclone that we discussed in connection with the recent Arctic storm; the circulation pattern this month, with low pressure to the north and northwest of Alaska, is broadly similar, although this year the main anomaly is farther to the north and away from Alaska.  Here's a map of the sea-level pressure anomaly in August 2012.


It is interesting, to say the least, that August has been so consistently wet at Red Dog in the past 5 years.  The figure below shows the distribution of precipitation totals for each month of the year, with the columns showing the absolute range and the horizontal markers indicating the median for each month.  It's intriguing to consider whether August has always been by far the wettest month of the year in this area, or if the past several years have been very anomalous compared to the longer-term climate.  I suspect the latter is more likely to be true.


Finally, for context and future reference, here's the setting of the Red Dog site as visualized on Google Maps and from the FAA webcam view.  The CRN site appears to be just visible on the webcam view, just to the right of the road as it heads away from the airport to the southwest.